Share this link via
Or copy link

Article filters
Search Papers
byGabriel Alejandro Hernández Nava, Sergio Aranda Ocampo*, Guadalupe Valdovinos Ponce, Obdulia Segura León, Mónica Osnaya González, Eridani García Vázquez, Sergio Ramírez Rojas, Leonardo Hernández Aragón
Received: 19/August/2024 – Published: 21/April/2025 – DOI: https://doi.org/10.18781/R.MEX.FIT.2408-3
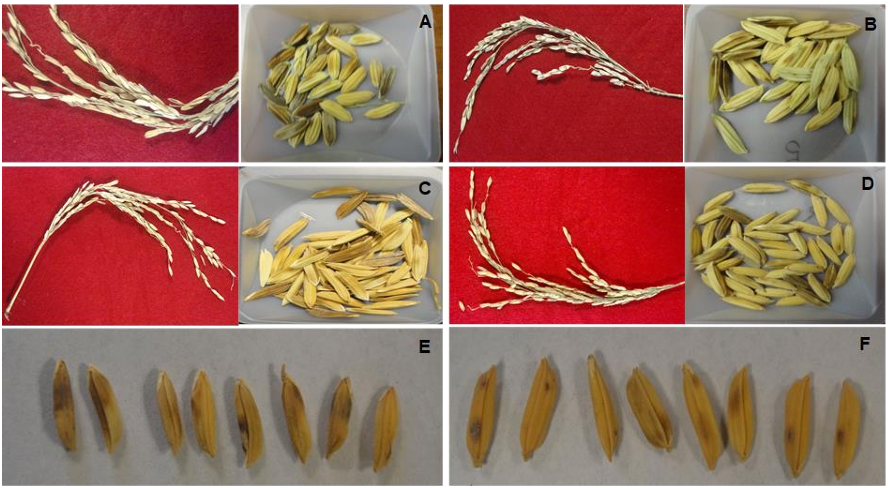
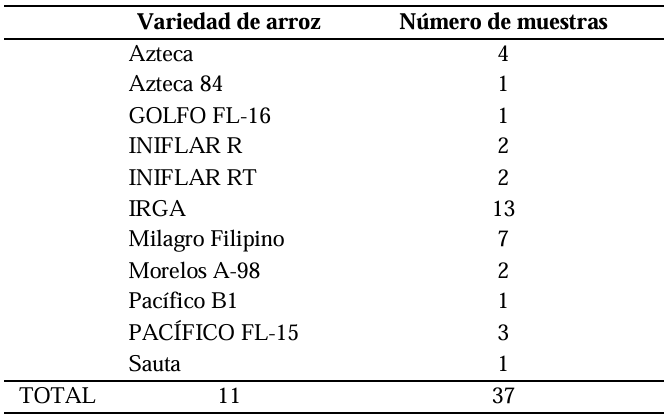
Abstract Backgrounds/Objectives. Burkholderia glumae is the most important pathogen transmitted through seeds that reduces the yield of rice (Oryza sativa). In 2022, seeds were found with symptoms of glume blotch in Mexico. The aim of this investigation was to characterize and identify the causal agent of the symptoms of glume blotch of 11 varieties of rice planted in Mexico.
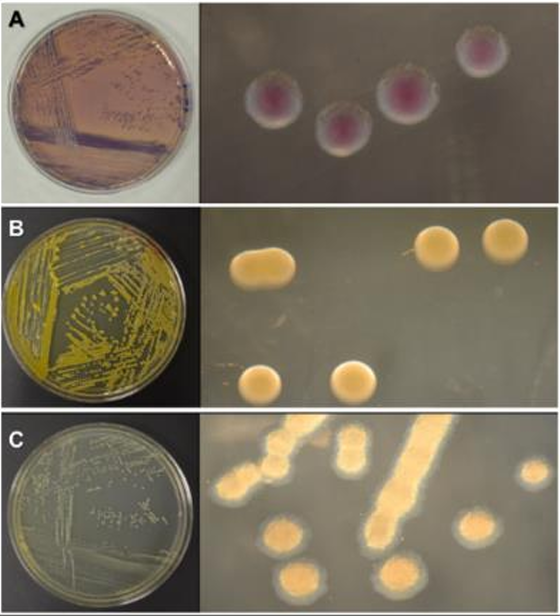
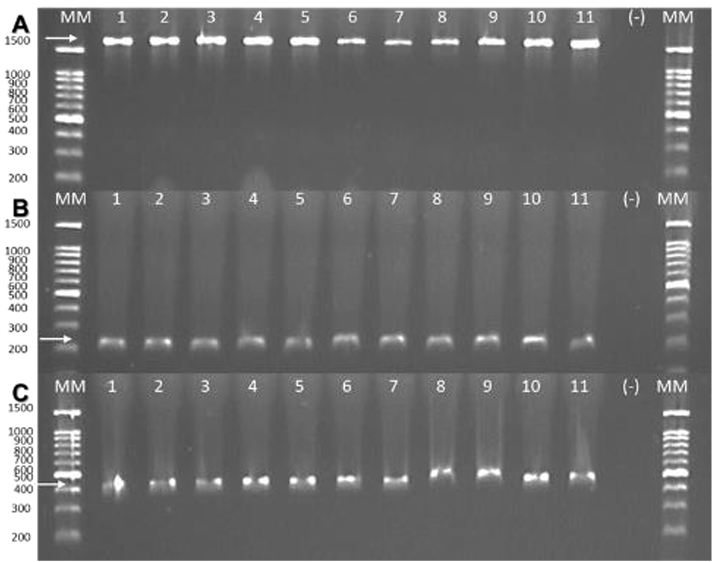
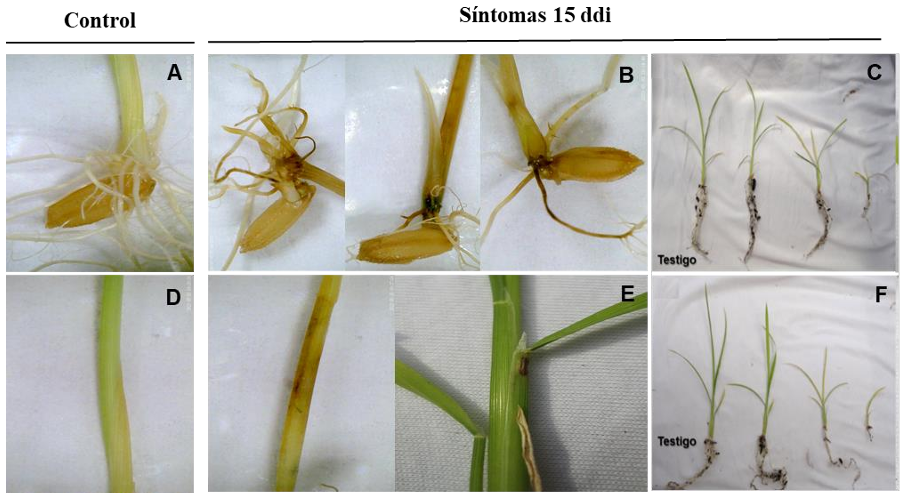
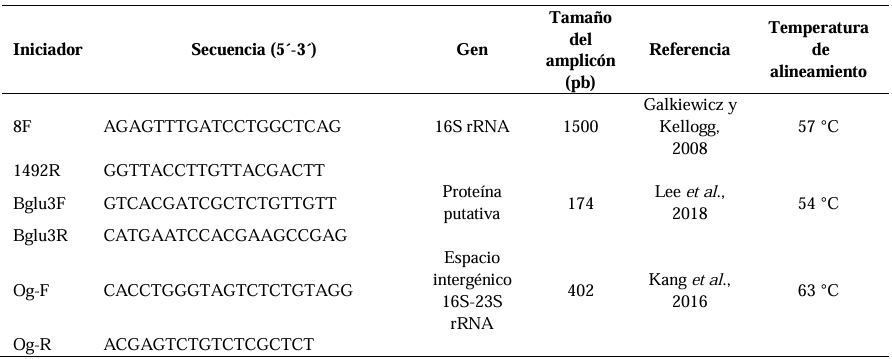
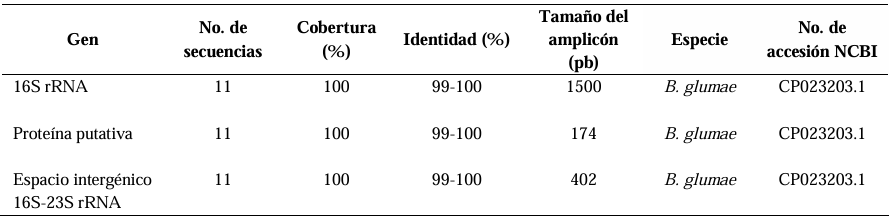
Materials and Methods. A total of 37 seeds samples were analyzed. From each sample, 1 g of seed was disinfested with sodium hypochlorite and macerated in a PBS buffer and subsequently streaked onto SPG, B de King and Wilbrinks culture media. The isolated bacterial strains were characterized by API20 and identified by amplification and partial sequencing of universal and specific genes. Pathogenicity was evaluated using a 3.5 x 10⁸ CFU mL-1 suspension on rice seeds and seedlings of the Milagro Filipino and INIFLAR R varieties.
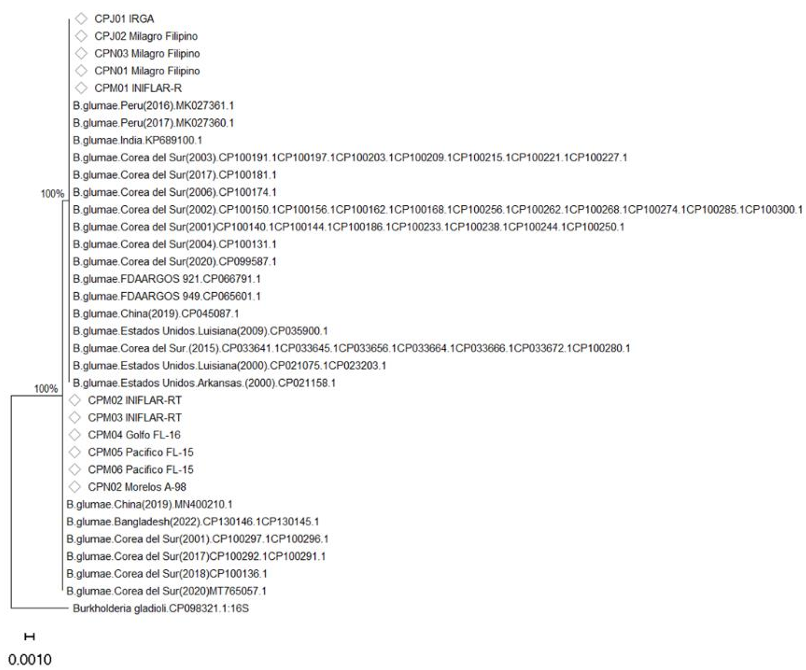
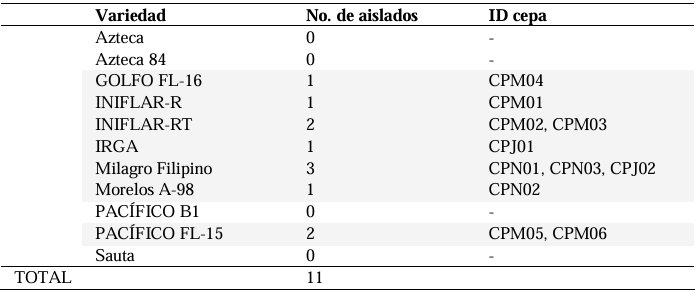
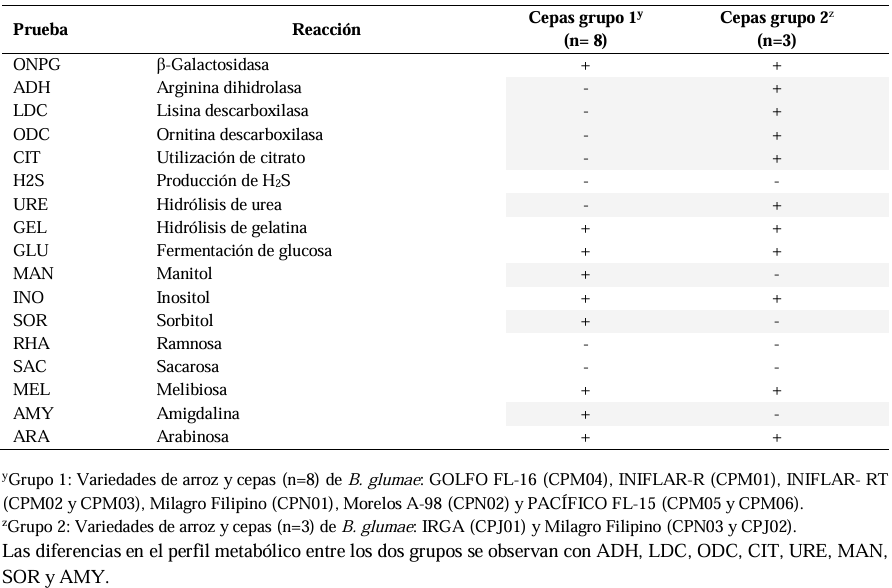
Results. Out of 37 samples, in nine (24.3 %), 11 isolates were taken with the morphology described for B. glumae. Characterization by API20 identified two groups with different metabolic profiles between the 11 strains. With PCR, the 11 strains were identified with a coverage of 100% as B. glumae with the universal primers 8F-1492R, and specific to B. glumae Bglu3F-Bglu3R and OgF-OgR. The pathogenicity of B. glumae was confirmed in rice seeds and seedlings of the Milagro Filipino and INIFLAR-R varieties.
Conclusion. B. glumae is the causal agent of the symptoms of glume blotch in rice seeds, and it was detected in seeds from seven varieties (63.6 %): GOLFO FL-16, INIFLAR-R, INIFLAR-RT, IRGA, Milagro Filipino, Morelos A-98 and PACÍFICO FL-15 of 11 rice varieties planted in Mexico.
Share this link via
Or copy link
byRicardo Del Porte Argueta, Maura Téllez Téllez, Ma. de Lourdes Acosta Urdapilleta, Olga Gómez Rodríguez, Arnoldo Wong Villarreal, Christian Carreño Campos, Liliana Aguilar Marcelino*
Received: 27/July/2024 – Published: 17/April/2025 – DOI: https://doi.org/10.18781/R.MEX.FIT.2407-2
Abstract Background/Objetive. The chili pepper (Capsicum annuum) is one of the most important agricultural crops in Mexico. Due to this, the aims were to determine the in vitro effect of the spent substrate by the edible fungus P. ostreatus, strain HEMIM-50, (SSPO) against N. aberrans and evaluate the in situ effectiveness of the SSPO against N. aberrans in chili pepper plants.
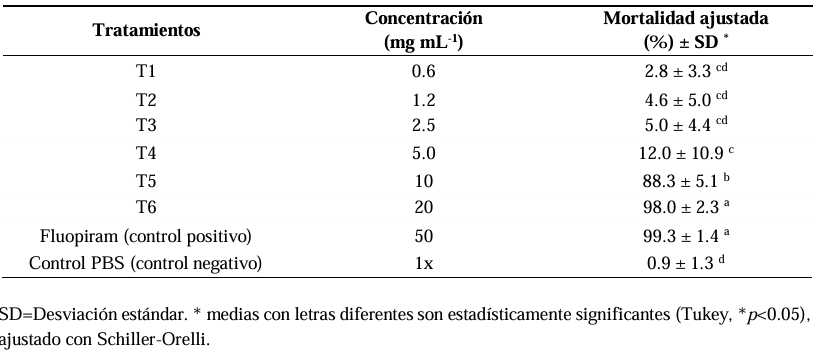
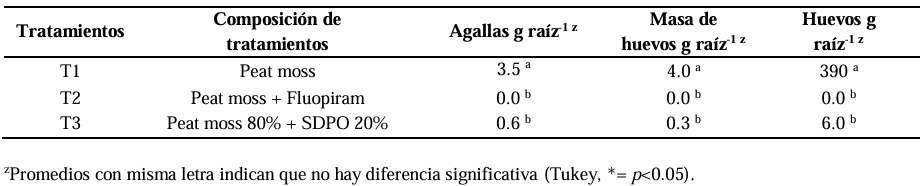
Material and methods. For the in vitro test, six serial concentrations of the hydroalcoholic extract (SSPO), ranging from 0.62 to 20 mg mL-1 against N. aberrans juveniles. An ANOVA was carried out, followed by Tukey’s means comparison test (p<0.05), adjusted with Schiller-Orelli. For the in situ assay with chili pepper plants, three treatments were evaluated: control (Peat moss), nematicide (Peat moss + Fluopiram) and SSPO (Peat moss 80% + SSPO 20%) and galls, egg masses and eggs per gram of root were measured after 45 days. The data were analyzed using the GLM and LSD tests to compare the means of each treatment. All statistical analyses were analyzed in the Statistical Analysis System program, SAS 9.0.
Results. The highest percentage of mortality was obtained with 20 mg mL-1 of the SSPO with a mortality of 98% of mortality and had no significant difference with the positive control with Fluopiram (p<0.05), followed by a mortality of 88.3% with the treatment at 10 mg mL-1. In the in situ evaluation in a combination of Peat moss 80% + SSPO 20%, a reduction of 82% in the number of galls was observed, along with 99% in the mass of eggs and 98% in the number of N. aberrans in comparison with the control with Peat moss. There were no significant differences (0.0b) with the combination of Peat moss + Fluopiram commercial nematicide (Tukey, p<0.05).
Conclusion. The spent substrate by P. ostreatus (SSPO) had an in vitro nematocidal activity (98%) against juvenile N. aberrans nematodes; in addition, the input in which the fungus was planted presented a reduction in galls of 82% and 98% for in situ N. aberrans egg mass that infected the chili pepper crop.
Share this link via
Or copy link
In vitro antagonism of Trichoderma against Sclerotium rolfsii from potato (Solanum tuberosum)
byGabriel Herrera Rodríguez, Gabriel Antonio Lugo García*, María Belén Irazoqui Acosta, Diana Laura Muñoz Bojórquez, Sara Elodia Armenta López, Rubén Félix Gastélum, Hugo Beltrán Peña, Guadalupe Arlene Mora Romero
Received: 23/November/2024 – Published: 17/April/2025 – DOI: https://doi.org/10.18781/R.MEX.FIT.2024-10
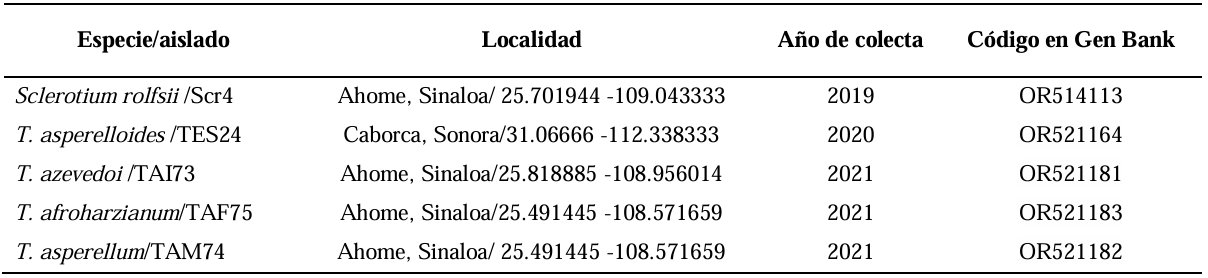
Abstract Background/Objective. Trichoderma constitutes a viable alternative for reducing the destructive potential of soft rot (Sclerotium rolfsii) in potato crops. The objectives of this research were to determine the in vitro antagonistic effectiveness of Trichoderma asperellum, T. asperelloides, T. afroharzianum, and T. azevedoi against S. rolfsii (Scr4 and Scr17) and to determine the hyphal interactions of the antagonists, on addition to determinate the inhibition of mycelial growth of S. rolfsii (Scr4) by volatile metabolites produced by Trichoderma species.
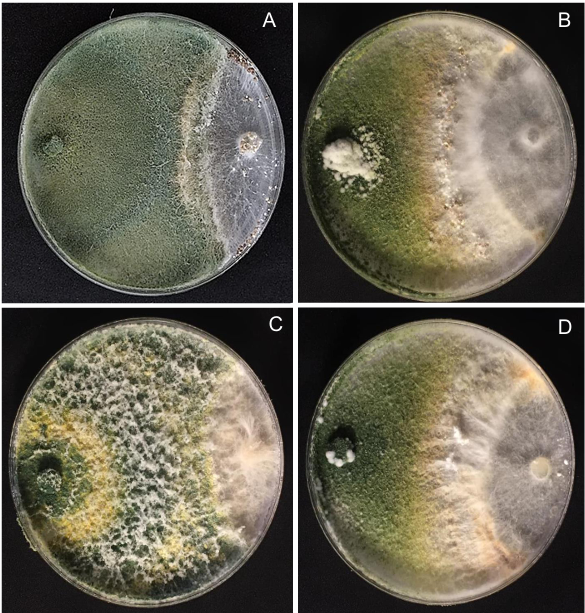
Materials and Methods. The in vitro biological effectiveness of 16 T. asperellum isolates, five T. asperelloides isolates, four T. afroharzianum isolates, and one T. azevedoi isolate in inhibiting S. rolfsii (Scr4 and Scr17) mycelial growth was studied. The type of hyphal interaction between the same Trichoderma spp. isolates and S. rolfsii (Scr4) was also determined. The effect of volatile metabolites produced by Trichoderma spp. isolates on the inhibition of mycelial growth of S. rolfsii (Scr4) was evaluated. Data on mycelial growth inhibition were analyzed using nonparametric statistical analysis (Kruskal Wallis), and the mean separation was performed using the procedures of Conover (1999) with (P ≤ 0.05).
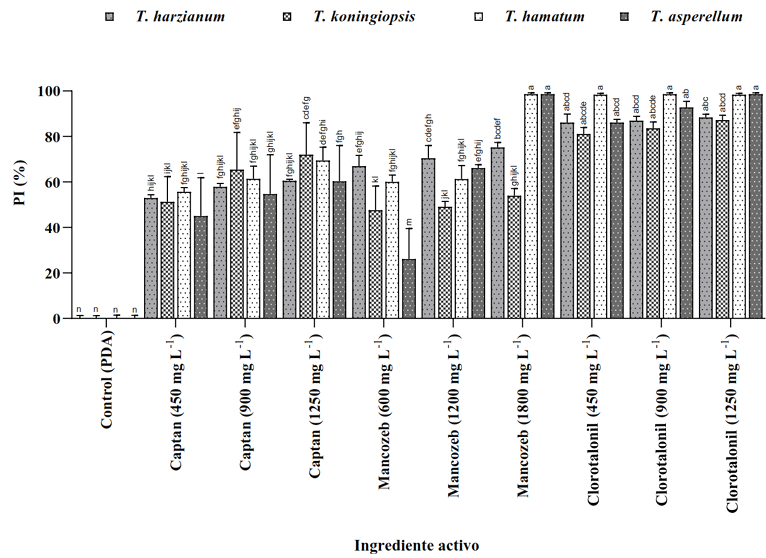
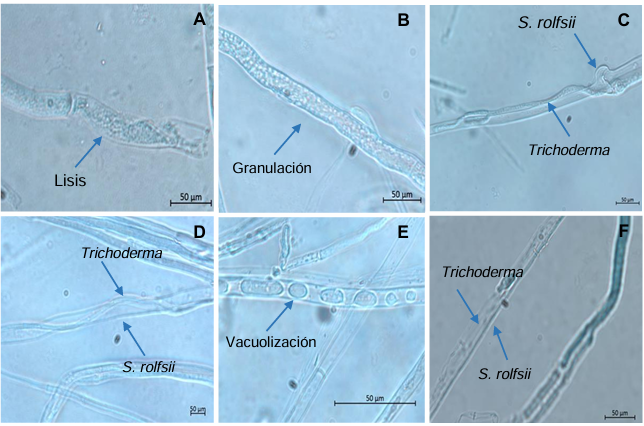
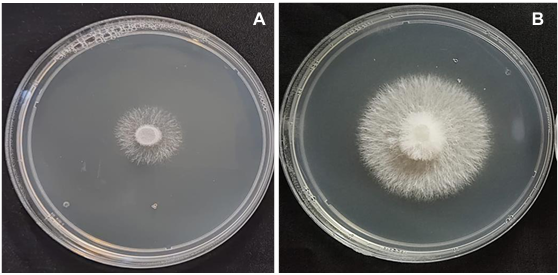
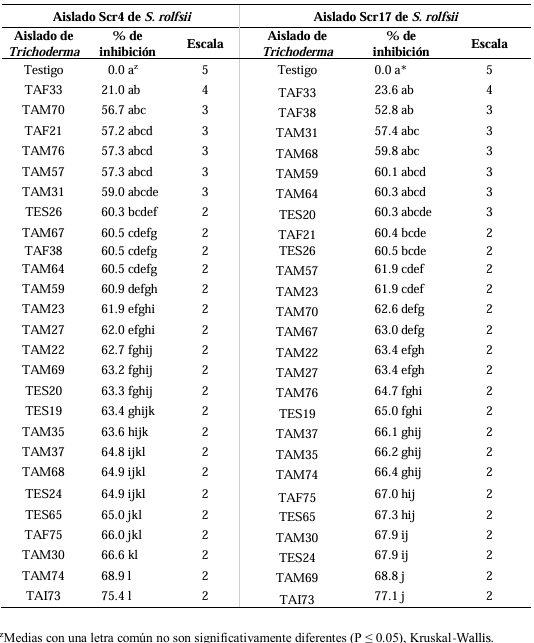
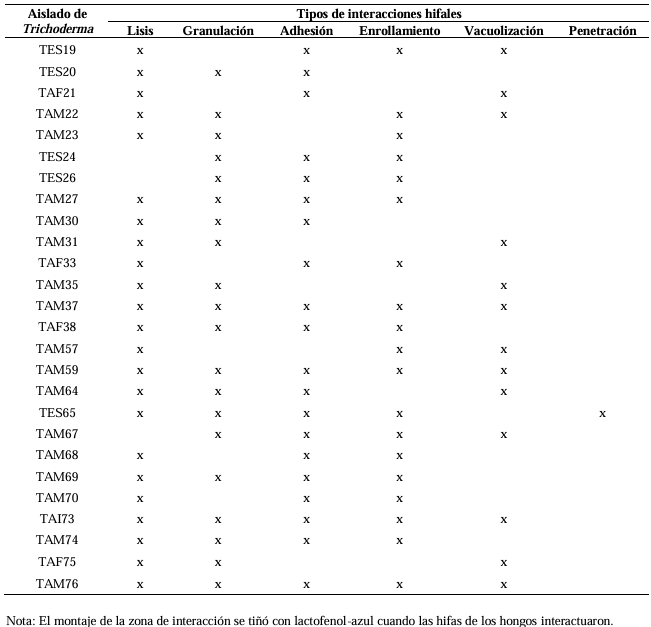
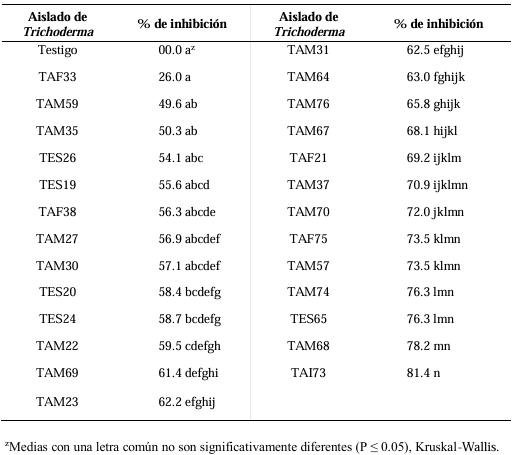
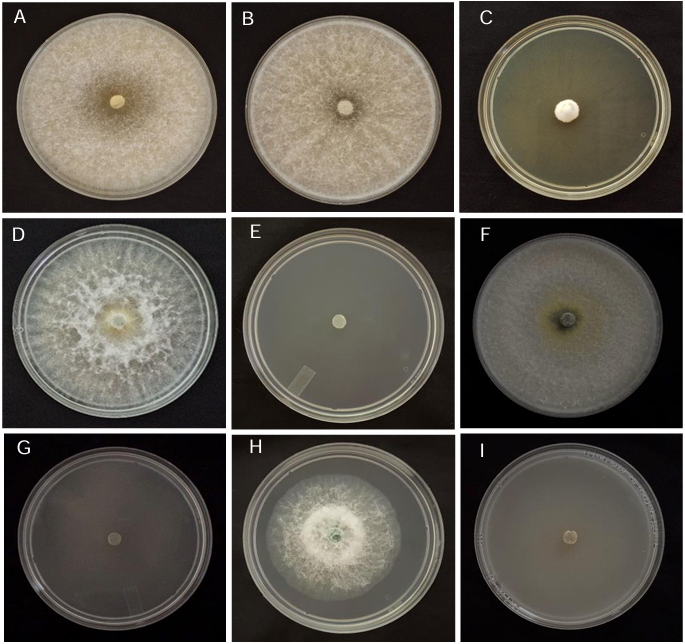
Results. In dual confrontations, Trichoderma species showed mycelial growth inhibitions of 21.0 to 75.4% and 23.6 to 77.1% in S. rolfsii isolates Scr4 and Scr17, respectively. Hyphal interactions of the same Trichoderma species consisted of vacuolization, granulation, coiling, adhesion, lysis, and penetration into the pathogen (Scr4); all four Trichoderma species inhibited mycelial growth (26.0 to 81.4%) of S. rolfsii. T. azevedoi stood out among the isolates for showing greater antagonistic capacity in all tests.
Conclusion. The results indicate that Trichoderma species, especially T. azevedoi (TAI73), inhibited the growth of S. rolfsii Scr4 (75.4%) and Scr17 (77.1%). T. azevedoi (TAI73) caused vacuolization, granulation, coiling, adhesion, and lysis of hyphae in the Scr4 isolate.
Share this link via
Or copy link
byGabriel Herrera Rodríguez, Gabriel Antonio Lugo García1, María Belén Irazoqui Acosta, José de Jesús Lara Flores, Sara Elodia Armenta López, Rubén Félix Gastélum*, Hugo Beltrán Peña, Guadalupe Arlene Mora Romero
Received: 30/May/2024 – Published: 14/April/2025 – DOI: https://doi.org/10.18781/R.MEX.FIT.2405-12
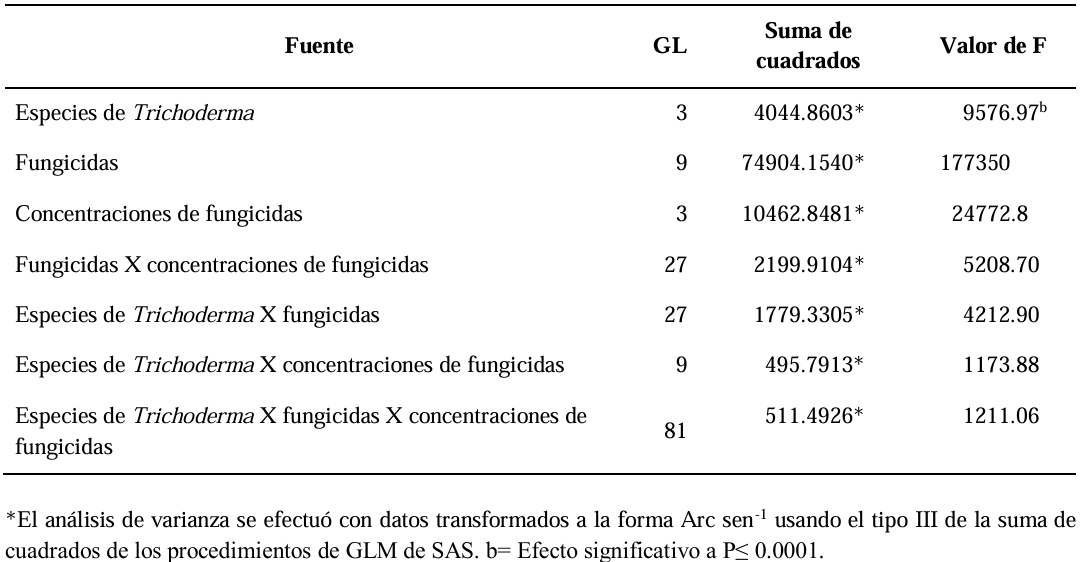
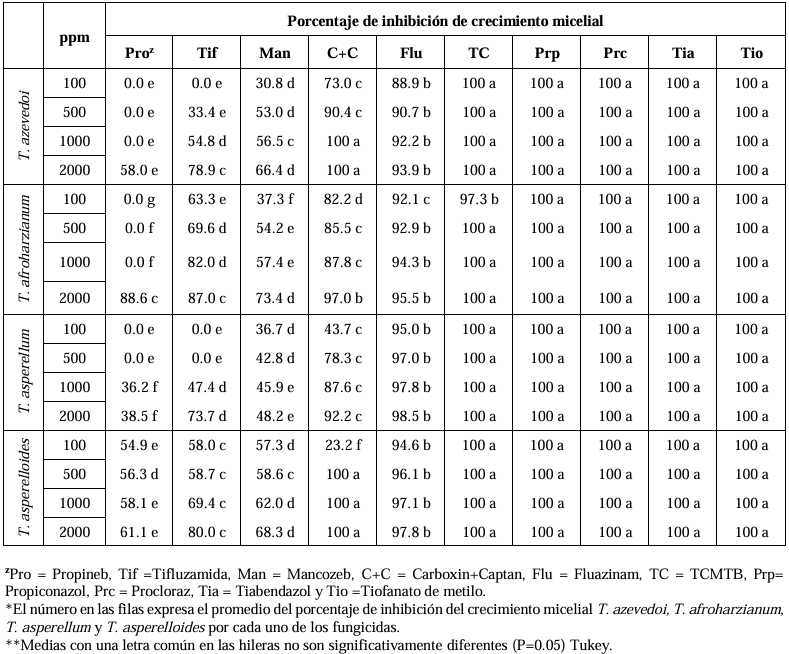
Abstract Background/Objective. Soft rot of potato tubers, caused by Sclerotium rolfsii, is a disease that occurs in soils with high levels of humidity and temperatures above 30 °C. Synthetic fungicides are primarily used for its control. The objectives of this study were to determine the biological efficacy of synthetic fungicides at different concentrations against the pathogen and the sensitivity of four species of Trichoderma to commonly used fungicides in potato in Sinaloa.
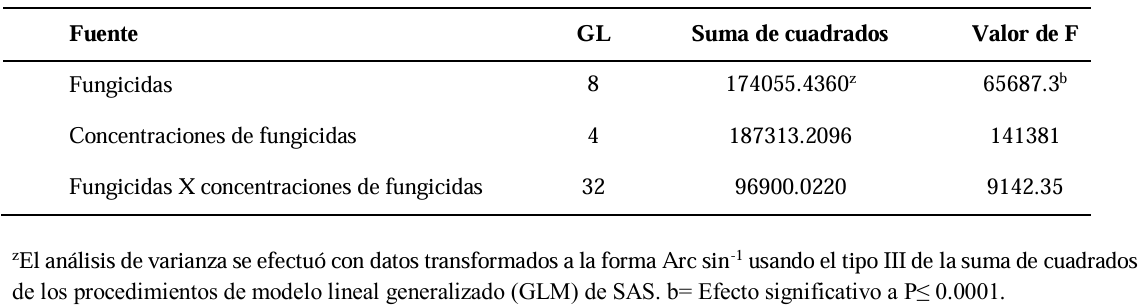
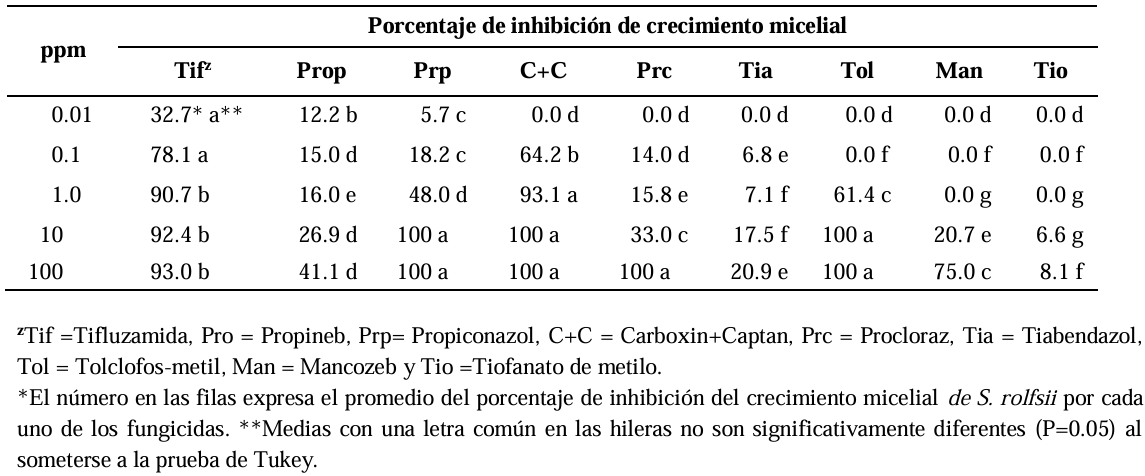
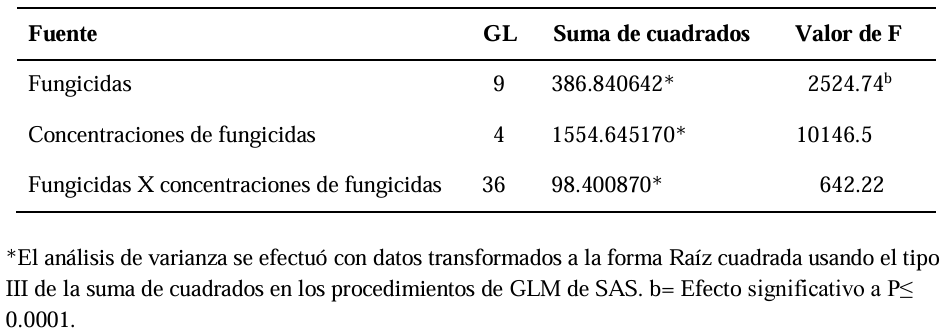
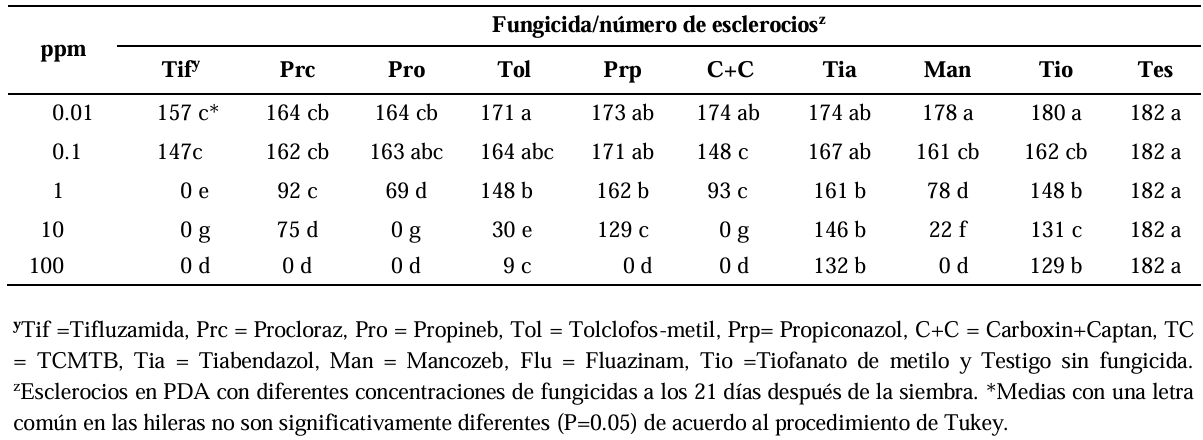
Materials and Methods. The in vitro efficacy of nine fungicides at concentrations of 0.01, 0.1, 1, 10 and 100 ppm on mycelial growth inhibition and sclerotia formation of S. rolfsii was determined. Furthermore, the in vitro sensitivity of T. afroharzianum, T. asperelloides, T. asperellum, and T. azevedoi to 10 fungicides at concentrations of 100, 500, 1000, and 2000 ppm was studied. The experiment was conducted twice. Treatments were distributed in a completely randomized design and data were subjected to ANOVA. Means were compared with the Tukey test (p < 0.05).
Results. Thifluzamide and Propineb at the 0.01 ppm concentration inhibited mycelial growth S. rolfsii by 32.7 and 12.2%, respectively. On the other hand, S. rolfsii produced 157, 164, and 164 sclerotia per Petri dish on PDA supplemented with the fungicides. Thifluzamide, Propineb and prochloraz, respectively, at the same concentration. In contrast, Propineb at a concentration of 100 ppm inhibited the mycelial growth of T. azevedoi, T. afroharzianum, T. asperellum and T. asperelloides by 0, 0, 0 and 54.9%, respectively; while the inhibition of mycelial growth by Thifluzamide at the same concentration in T. azevedoi, T. afroharzianum, T. asperellum and T. asperelloides ranged from 0 to 63%. The results indicate that the four Trichoderma species are compatible with both fungicides.
Conclusion. The effect of thifluzamide and propineb on mycelial growth inhibition and sclerotia formation of S. rolfsii, as well as their compatibility with the four species Trichoderma, indicates that the combination of Trichoderma spp. and the fungicides has potential use for controlling soft rot of potato tubers under field conditions.
Share this link via
Or copy link
Resistance of Triticale (× Triticosecale) varieties to Fusarium spp.
byGloria Sánches Jiménez, Santos Gerardo Leyva Mir, Mateo Vargas Hernández, María Florencia Rodríguez García*, Héctor Eduardo Villaseñor Mir
Received: 24/November/2024 – Published: 14/April/2025 – DOI: https://doi.org/10.18781/R.MEX.FIT.2305-3
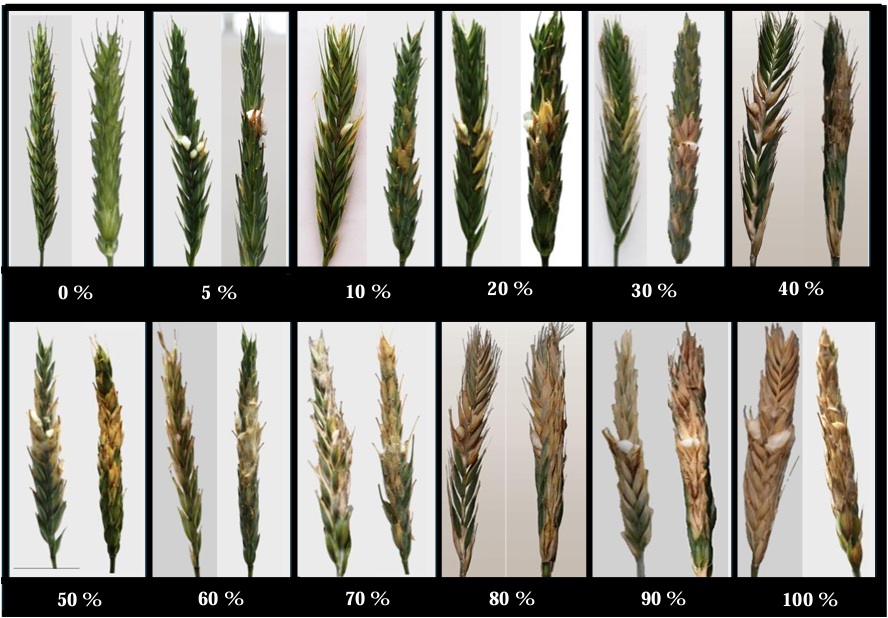
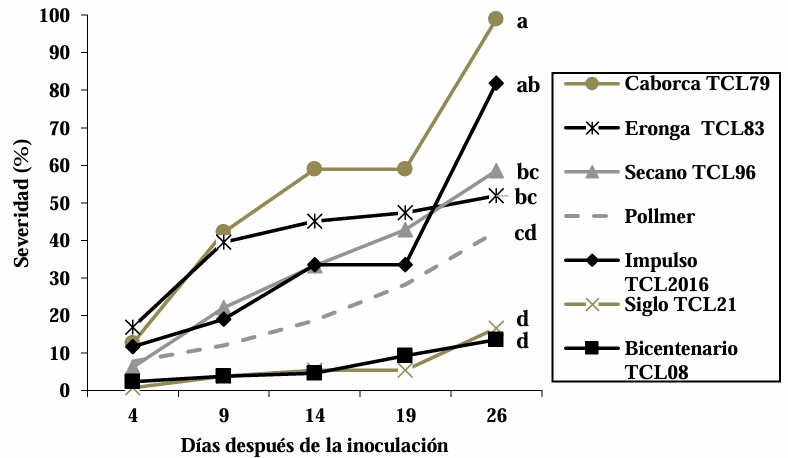
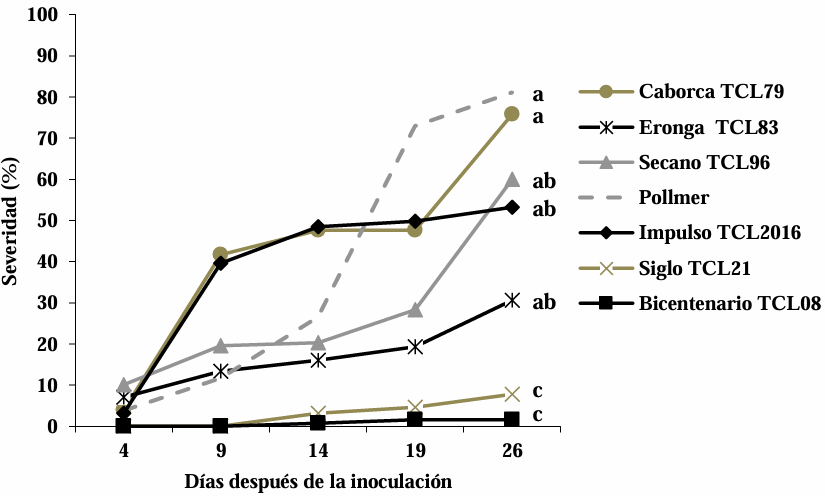
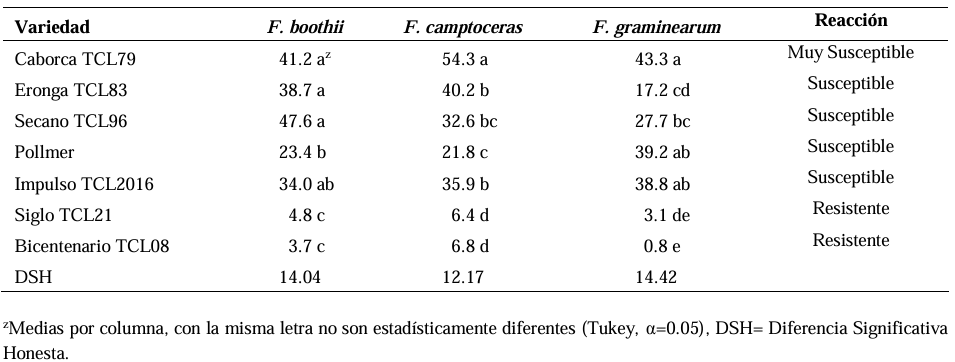
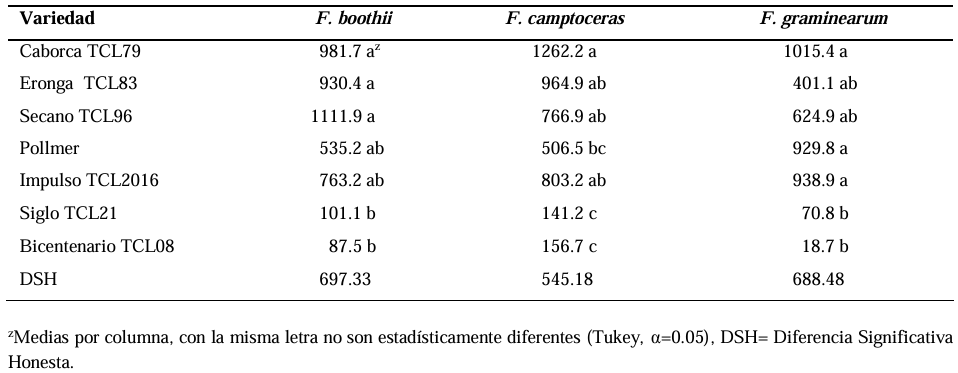
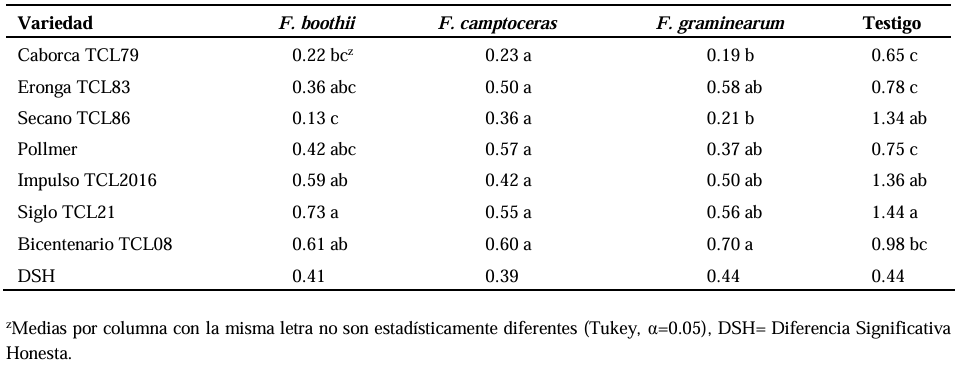
Abstract Background/Objective. Fusarium head blight (FHB) is mainly caused by Fusarium spp. species, and is a disease that affects the yield and quality of cereal grain. The objective was to evaluate the resistance in adult plants of seven triticale varieties to Fusarium boothii, F. camptoceras and F. graminearum.
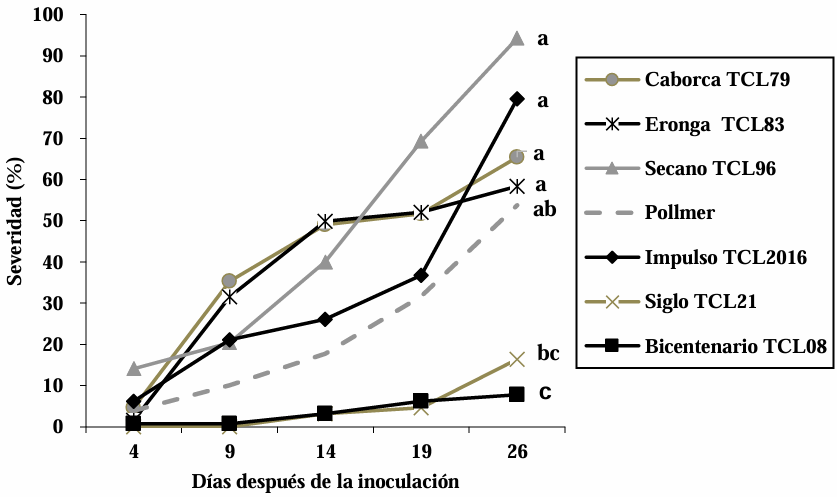
Materials and Methods. The experiment was established under greenhouse conditions at INIFAP-CEVAMEX. The pathogenicity tests were carried out during the flowering stage, by means of spot inoculation by the cotton method. The severity of the disease in the spikes was assessed at 4, 9, 14, 19 and 26 days after inoculation.
Results. The analysis of variance showed significant differences (p≤0.01) between varieties where variation in resistance was observed. The varieties Siglo TCL21 (3.1 to 6.4%) and Bicentenario TCL08 (0.8 to 6.8%) showed the lowest severities and were resistant to the three species of Fusarium, while Secano TCL96 was the most susceptible variety to F. boothii, presenting 47.6% severity; for F. camptoceras and F. graminearum, the most susceptible variety was Caborca TCL79, with severity percentages of 54.3 and 43.3%, respectively. Grain weight per spike was affected up to 90% in susceptible varieties.
Conclusion. It is important to consider in triticale breeding programs the incorporation of resistance to several Fusarium species, standing out in the present study Siglo TCL21 and Bicentenario TCL08.
Share this link via
Or copy link
Effectiveness of biological and chemical fungicides for diseases control in barley (Hordeum vulgare)
byMaría Florencia Rodríguez García, Miguel González González*, Andrés Mandujano Bueno
Received: 20/November/2024 – Published: 05/April/2025 – DOI: https://doi.org/10.18781/R.MEX.FIT.2024-13
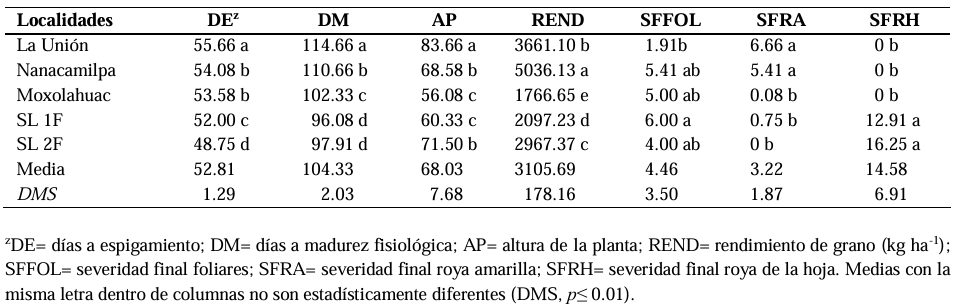
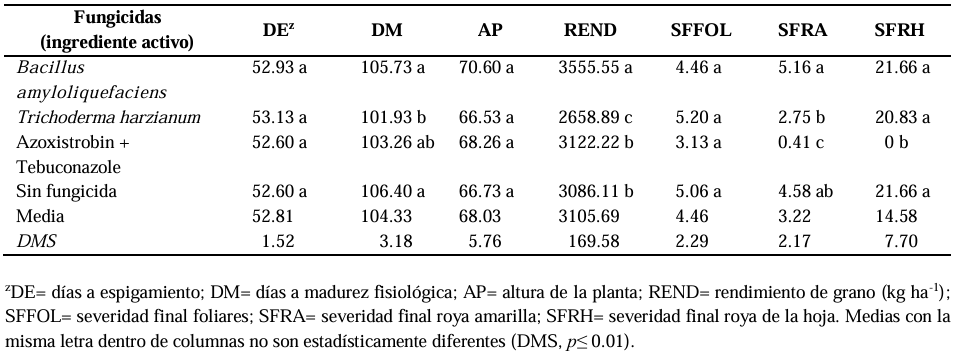
Abstract Background/Objective. In the cultivation of barley in Mexico, diseases cause economic losses; chemical control has been the most effective way to mitigate their effects; however, it is necessary to explore other environmentally friendly control strategies. The objective was to compare, under field conditions, the effectiveness of biological and chemical fungicides for the control of pathogens that cause the main barley diseases.
Materials and Methods. In spring-summer 2022, five experiments were conducted in different environments. The design was randomized complete blocks with three repetitions. Esmeralda was the variety used. Two biological fungicides (SERENADE® OPTI and Trichoderma Sub) were evaluated; and one, chemical (Azimut® 320 SC). They were applied three times. The diseases occurred naturally. The variables measured were: days to heading (DH), days to physiological maturity (DPM), plant height (PH), grain yield (YIELD), final disease severity: foliar (FFOLS), yellow rust (FYRS), leaf rust (FLRS).
Results. The analysis of variance showed significant variation for YIELD, FYRS and FLRS (p≤0.01). In YIELD, the best biological fungicide was SERENADE® OPTI with a yield of 3,555 kg ha-1, compared to the control (3,086 kg ha-1). For FYRS and FLRS the most effective was Azimut® 320 SC, followed by Trichoderma Sub.
Conclusion. The efficacy of the chemical for foliar diseases was 38 %, yellow rust 91 %, and leaf rust 100 %. Chemical control continues to be the most effective for controlling pathogens that cause barley diseases.
Share this link via
Or copy link
byJosé Terrones Salgado*, Carlos David Carretillo Moctezuma, José Francisco Díaz Nájera, Sergio Ayvar Serna, José Luis Arispe Vázquez, César Flores de los Ángeles, Nicolás Álvarez Acevedo
Received: 15/November/2024 – Published: 02/April/2025 – DOI: https://doi.org/10.18781/R.MEX.FIT.2024-16
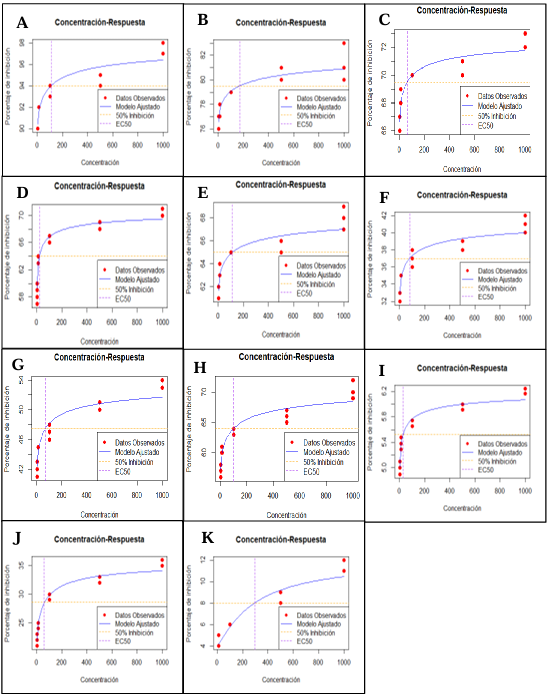
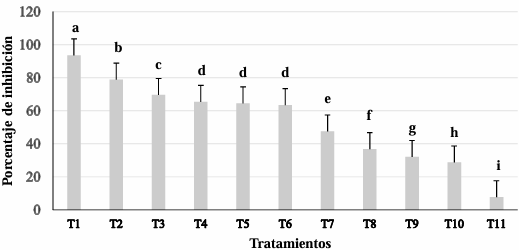
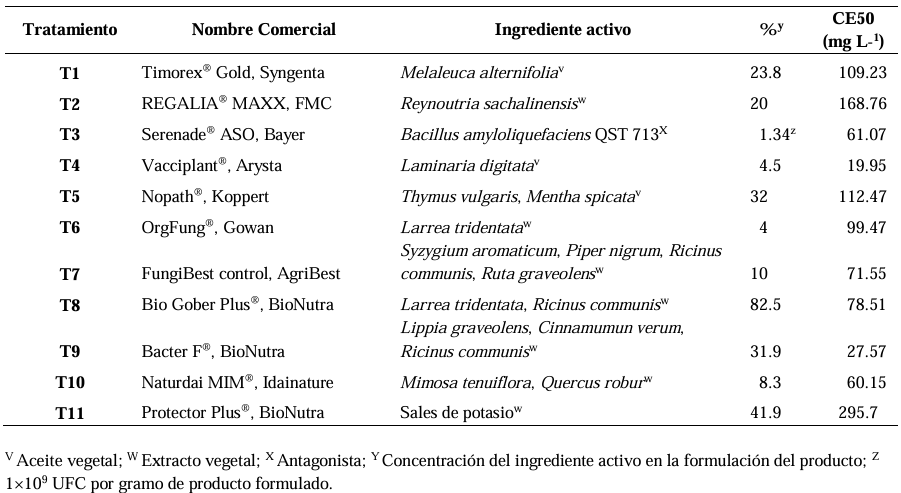
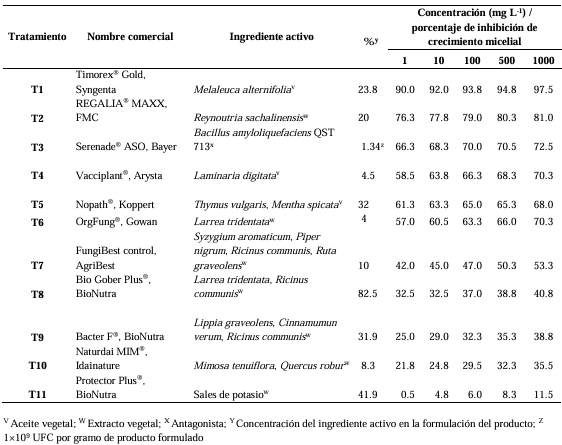
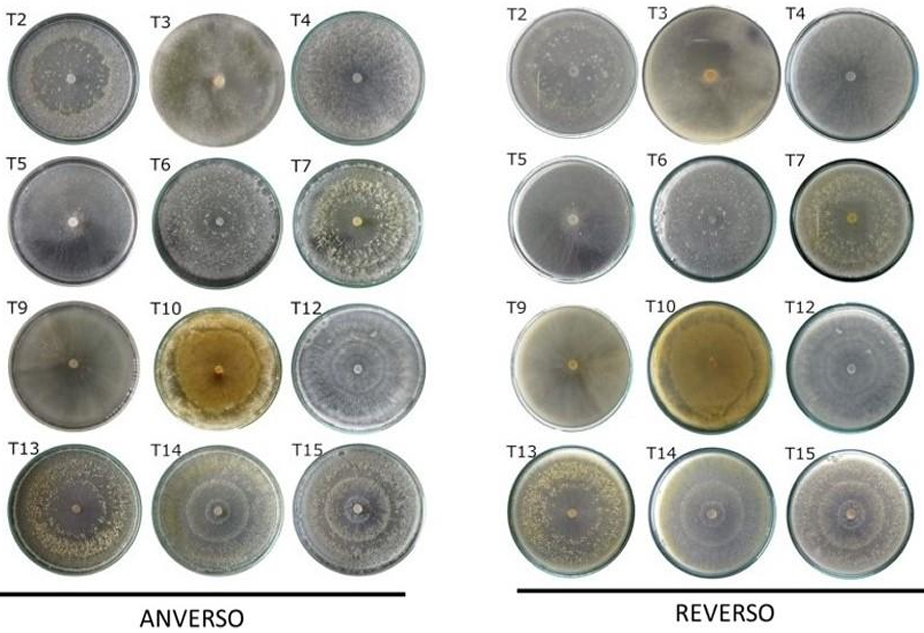
Abstract Background/Objetive. Colletotrichum truncatum is a phytopathogenic fungus that induces the anthracnose disease in the leaves of Echeveria gibbiflora (Echeveria), a native Mexican species with a great ornamental value. The aim was to evaluate the sensitivity of C. truncatum isolated from E. gibbiflora plants to 11 biofungicides as an alternative for the integrated management of the disease.
Materials and Methods. Through sensitivity tests, the percentage of fungal growth inhibition was determined in PDA medium modified with each biofungicide at concentrations of 0, 1, 10, 100, 500 and 1000 mg L-1. A completely randomized design with an 11 × 6 factorial arrangement (11 biofungicides × six concentrations) and four replications was used. The effective concentration of an inhibition of 50% (EC50) was determined by logistic regression.
Results. C. truncatum isolated from E. gibbiflora was the most sensitive to the Melaleuca alternifolia oil (EC50 = 109.23 mg L-1), extracto de Reynoutria sachalinensis (EC50 = 168.76 mg L-1) y Bacillus amyloliquefaciens QST 713 (EC50=61.07 mg L-1) in in vitro conditions. The Laminaria digitata oil (EC50 = 19.95 mg L-1), Thymus vulgaris and Mentha spicata essential oils (EC50 = 112.47 mg L-1) and the extract of Larrea tridentata and Ricinus communis (EC50 = 78.51 mg L-1) inhibited more than 50% of the growth of the fungus.
Conclusion. The L. digitata oil, T. vulgaris and M. spicata essential oils and the L. tridentata and R. communis extract have an inhibiting effect on the growth of the fungus of over 50%. These results contribute to the knowledge of the integrated management of C. truncatum that causes leaf anthracnose in E. gibbiflora with the application of biofungicides.
Share this link via
Or copy link
byAbimael Rubio Sosa, Misael Martínez Bolaños, Juan Florencio Gómez Leyva, Salvador Lozano Trejo*, Ernesto Castañeda Hidalgo, Gustavo Omar Diaz Zorrilla
Received: 30/August/2024 – Published: 26/March/2025 – DOI: https://doi.org/10.18781/R.MEX.FIT.2307-1
Abstract Background/Objective. The objective of the study was to isolate and characterize native isolate of Trichoderma from organic crops of Arabica coffee (Coffea arabica) in Oaxaca state, as well as to evaluate their in vitro biocontrol potential against Colletotrichum spp., causal agent of anthracnose.
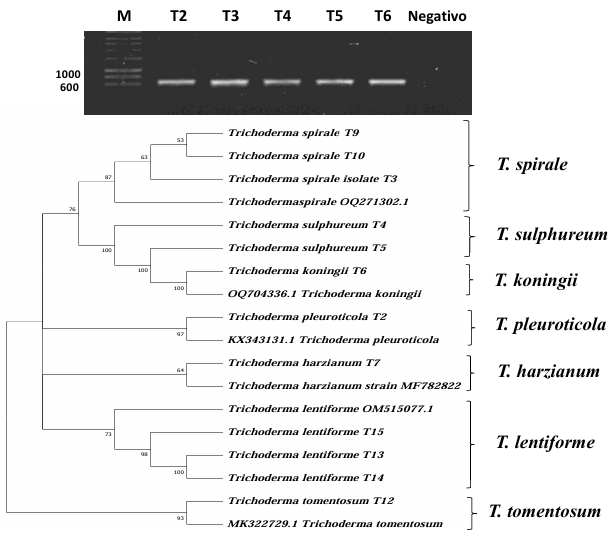
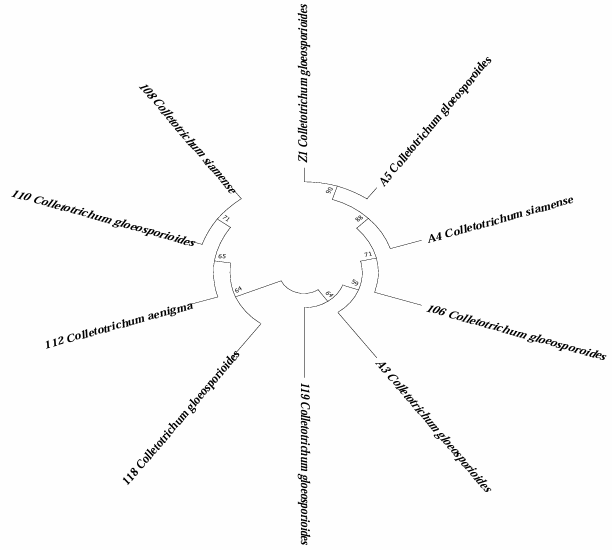
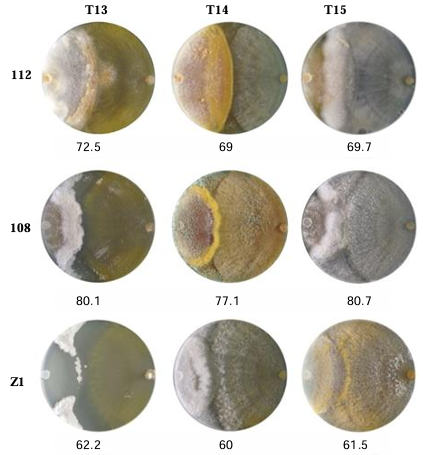
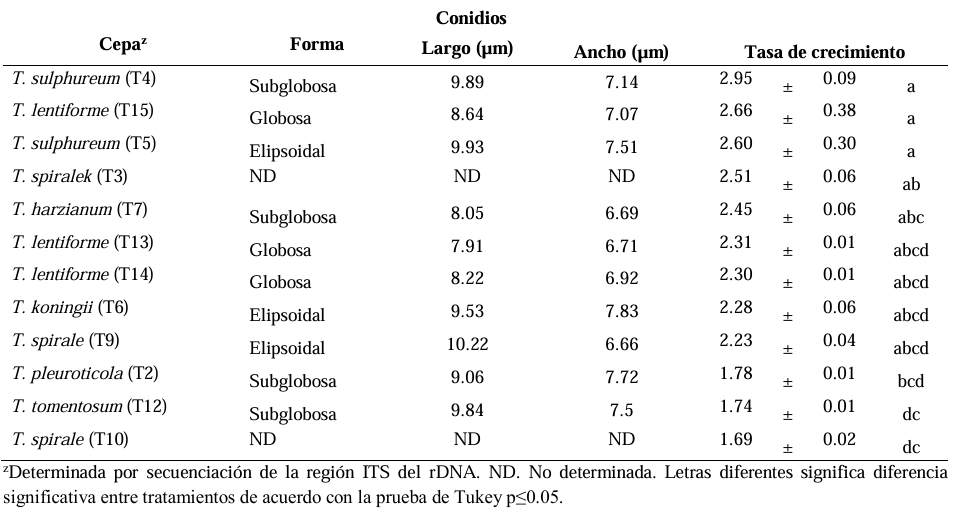
Materials y Methods. Soil and vegetative material samples were collected from coffee plant plots, from which fungal strains corresponding to the genera Trichoderma and Colletotrichum were isolated. Macroscopic and microscopic characterization was performed and the growth rate of each of the isolates was evaluated. Finally, molecular characterization was performed by sequencing the ITS region of rRNA. To evaluate the biocontrol potential, antagonism tests were performed between the isolates of the two genera.
Results. Seven different species were identified: T. harzianum, T. pleuroticola, T. sulphureum, T. tomentosum, T. koningii, T. spirale and T. lentiforme. The latter were the most abundant. Of these, T. lentiforme was selected and evaluated for its in vitro inhibition capacity against three Colletotrichum spp. It was observed that the growth of the fungus was inhibited by 20 to 80%.
Conclusion. The potential of Trichoderma as a biocontrol agent for Colletotrichum spp. is highlighted, acting in different ways against this phytopathogen. This contributes to the knowledge about the diversity of native Trichoderma species, to the coffee-growing region of the state of Oaxaca. In addition, this deeper knowledge contributes to enriching knowledge and choosing these species for future studies in the biocontrol of phytopathogens, in order to promote sustainable agricultural practices.
Share this link via
Or copy link
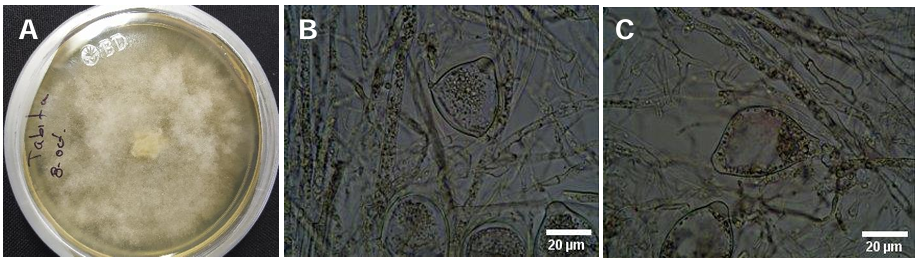
byTabita Queren Pérez Reyes, Santos Gerardo Leyva Mir, Mario Pérez Grajales*, María Teresa Martínez Damián, Rogelio Castro Brindis
Received: 30/August/2024 – Published: 08/March/2025 – DOI: https://doi.org/10.18781/R.MEX.FIT.2408-5
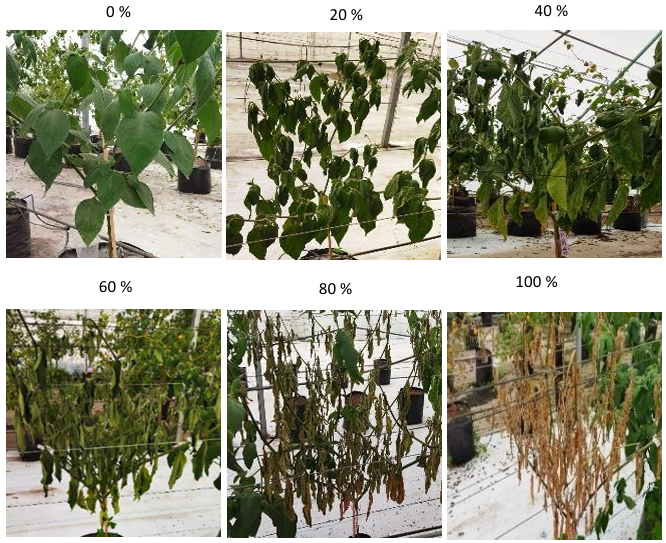
Abstract Background/Objective. Phytophthora capsici causes losses of up to 100 % in Capsicum pubescens and there are no resistant commercial varieties. A viable and sustainable alternative is to use the CM-334 rootstock (Capsicum annuum), which is universally resistant to Phytophthora capsici.
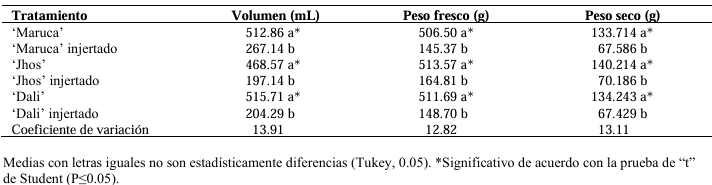
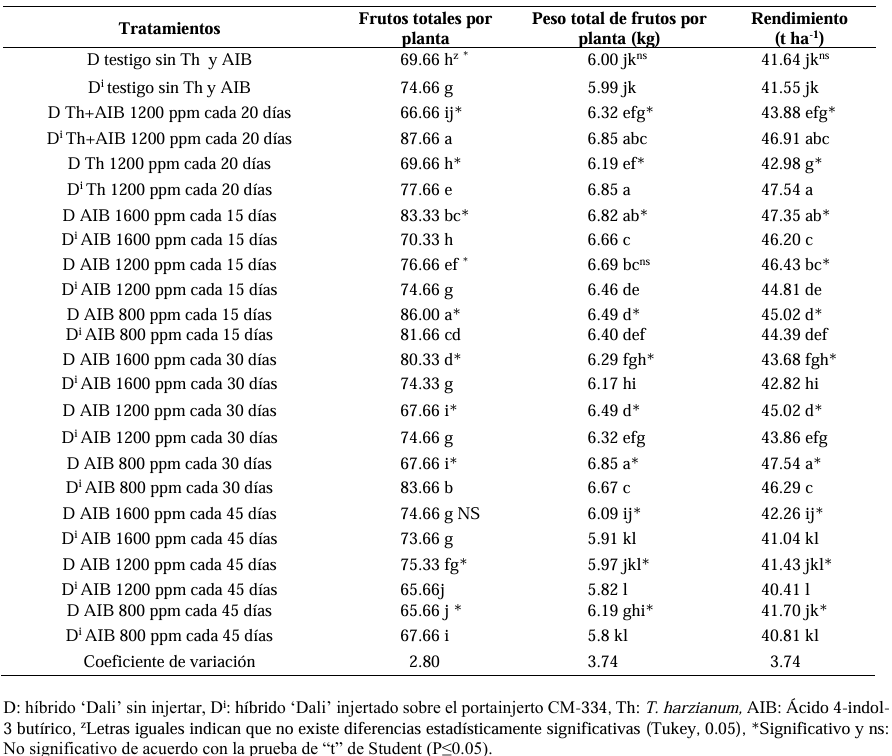
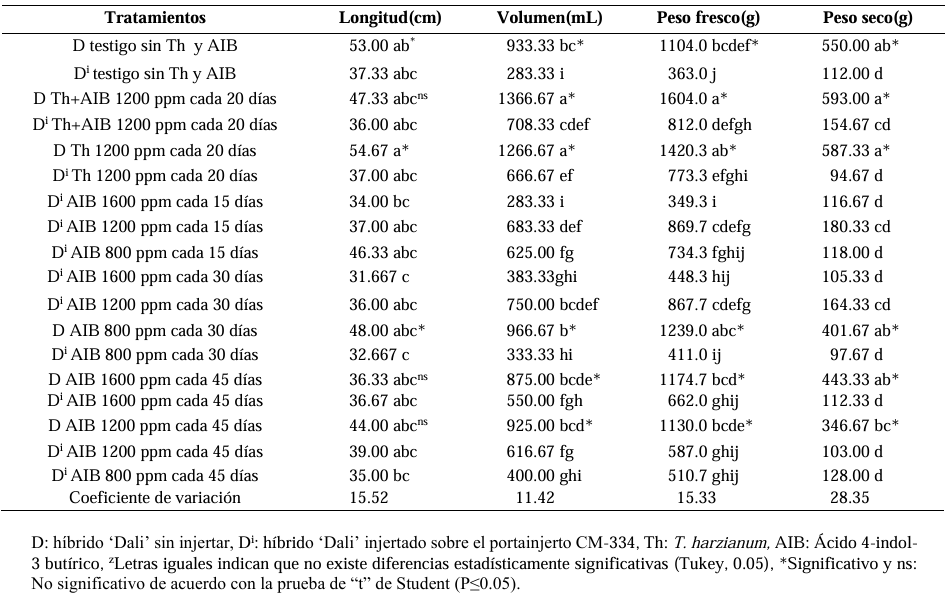
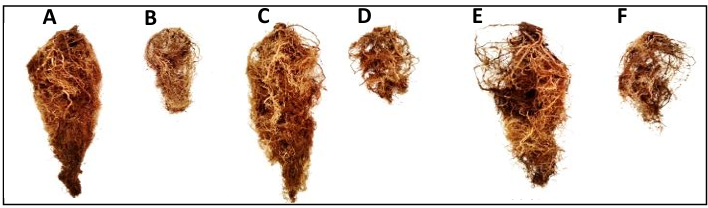
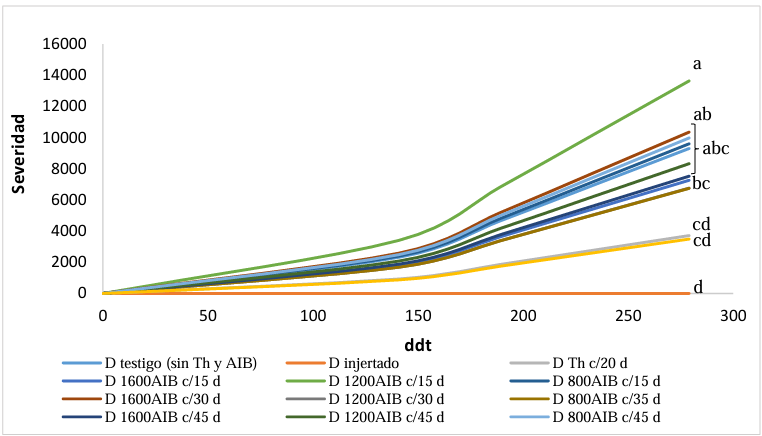
Materials and Methods. The following was studied: the root biomass of CM-334 when grafting the mazano chili hybrids ‘Maruca’, ‘Jhos’, and ‘Dali’, the resistance of the graft to P. capsici in infested soil and its yield (hybrid ‘Dali’), and the root biomass of CM-334 with applications of auxins and T. harzianum.
Results. As a rootstock, CM-334 exhibited 50, 53 and 75 % less root volume, fresh weight, and dry weight, respectively, compared to non-grafted hybrids. Using the CM-334 rootstock, there was no incidence of P. capsici and the yield decreased by 2 %, and even with T. harzianum, alone or in combination with 1200 ppm of IBA, the yield increased by 8 %. The grafted ‘Dali’ hybrid had 32, 50, 50, and 76 % less root length, volume, fresh weight, and dry weight, respectively, compared to the non-grafted hybrid; therefore, it is suggested to apply 1.25 kg ha-1 of T. harzianum and 1200 ppm of IBA every 20 days to improve root biomass.
Conclusion. Grafting manzano chili onto CM-334 is a viable and sustainable control alternative to reduce P. capsici incidence since none of the grafted plants showed wilt symptoms like the non-grafted ones, and the yield was the same as in the first production cycle, with the advantage that grafted plants produce more cycles (4 years), whereas the non-grafted ones die during the first cycle because of the oomycete.
Share this link via
Or copy link
byGermán Ramírez Jiménez, Omar G. Alvarado Gómez, Magdiel Torres de la Cruz*, Miguel Ángel Mayo Hernández, Ángel F. Huamán Pilco, Jorge R. Díaz Valderrama
Received: 07/June/2024 – Published: 21/February/2025 – DOI: https://doi.org/10.18781/R.MEX.FIT.2406-2
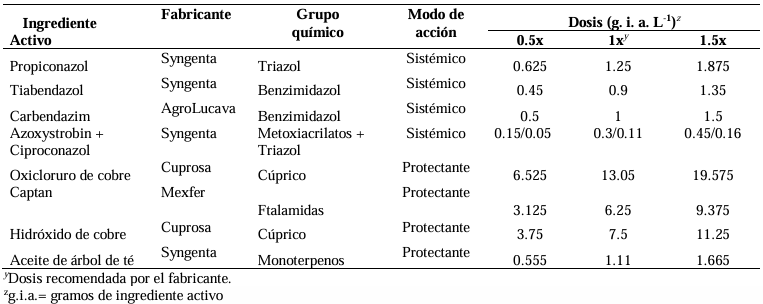
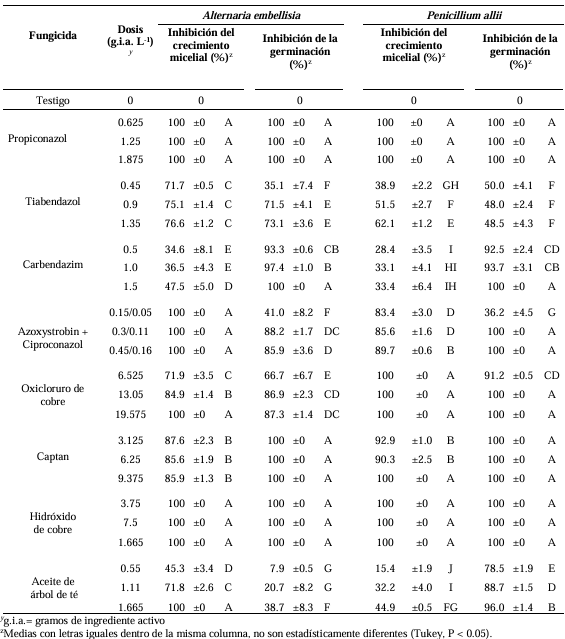
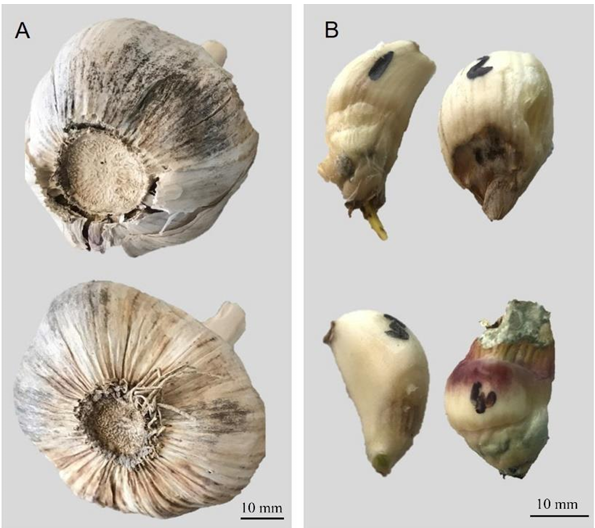
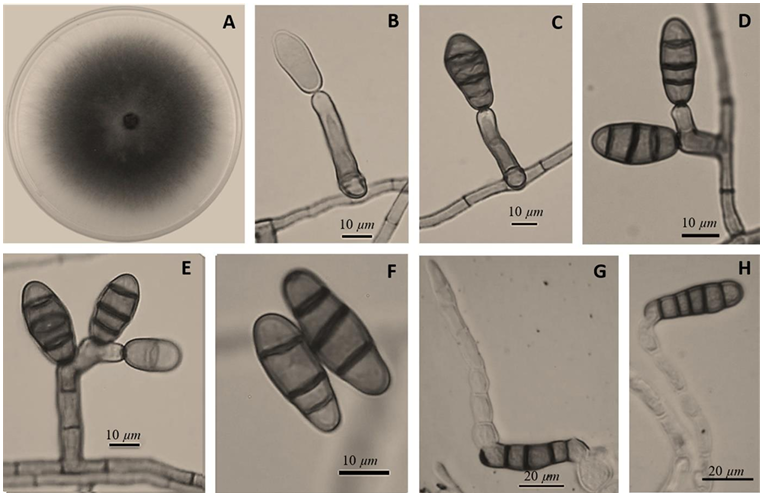
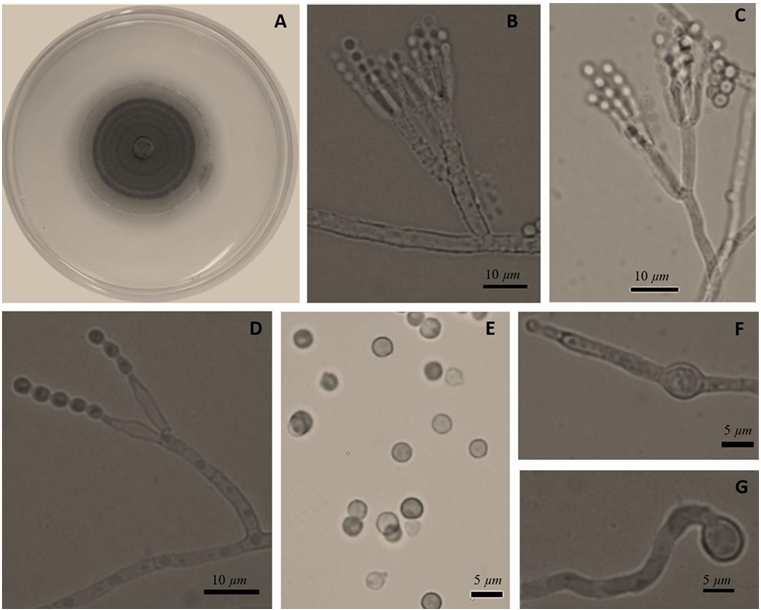
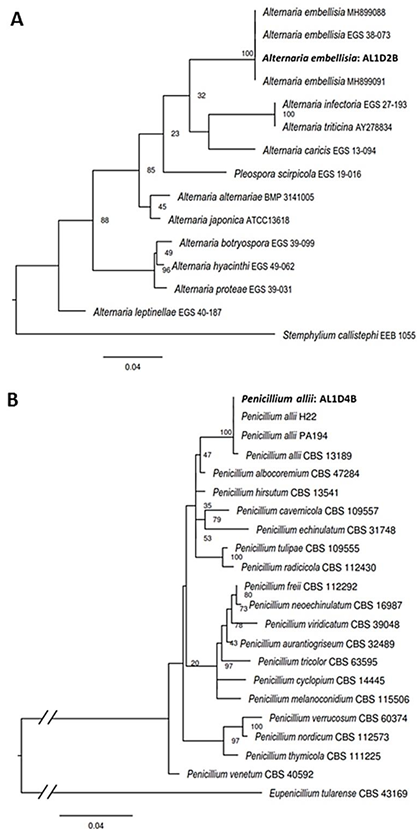
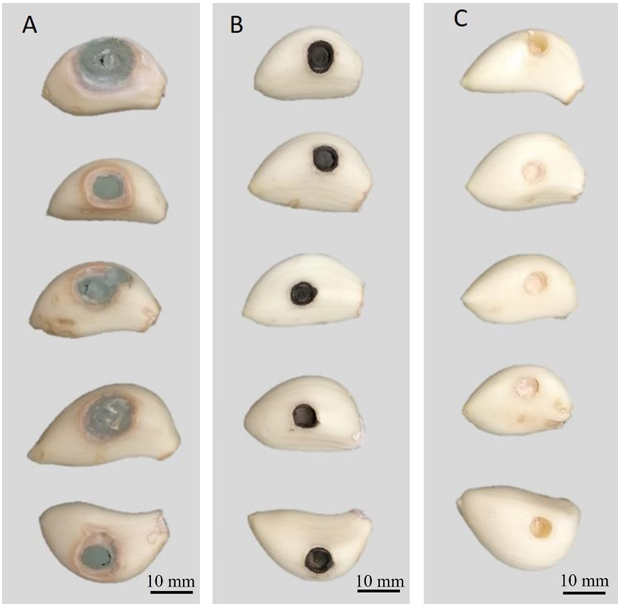
Abstract Background/Objective. Garlic (Allium sativum) is a crop of economic relevance in Mexico. Nuevo León stands out in production; however, in the municipality of Aramberri, post-harvest losses have been reported due to diseases of unknown etiology. The objective of this work was to identify the fungi associated with the postharvest deterioration of A. sativum bulbs in Aramberri, Nuevo León, Mexico and to evaluate their in vitro sensitivity to fungicides.
Materials and Methods. From bulbs with evidence of deterioration and necrosis, fungi were isolated in PDA medium. Four isolates were identified by morphological analysis and one isolate from each morphological species was identified by molecular analysis. The pathogenicity of the four isolates on symptom-free bulbil was evaluated. In addition, in vitro susceptibility tests of the isolates to protective and systemic fungicides were performed. Fungicides were evaluated at three concentrations and mycelial growth reduction (MGR) and conidial germination inhibition (CGI) was estimated.
Results. The fungi Alternaria embellisia and Penicillium allii were identified in association with A. sativum bulbs with postharvest deterioration. P. allii showed the ability to develop internal infections from wounds; A. embellisia only showed growth on wounds. There were significant differences (p <0.0001) in the effectiveness of fungicides on the two species. Propiconazole and copper hydroxide inhibited 100% MGR and CGI in both fungi, at all doses evaluated.
Conclusion. P. allii is first reported as a causative agent of green garlic rot in Mexico. This study will serve as a basis for choosing control strategies and will contribute significantly to reducing economic losses in garlic production in this region.
Share this link via
Or copy link