Logotipo de Revista Mexicana de Fitopatología

Mexican Journal
of Phytopathology

Logotipo Sociedad Mexicana de Fitopatología A.C.

Article filters

Search Papers

Búsquedas previas al 2023, Núm. 3. En la sección Volúmenes 30 - 41 (2012 - 2023).
<em>Iris yellow spot orthotospovirus</em> pathosystem, virus host and vector (<em>Thrips tabaci</em>). Figure 4 - Epidemiological system of a viral pathosystem focused on <em>Iris yellow spot Orthotospovirus</em> (based on and modified from Madden <em>et al.,</em> 2000). Notes used: v(t)= Total fertility rate of the insect population per day within the crop. Ґ= Virus incubation time within the vector. q= Probability that the offspring of the vector will be viruliferous. β= Plant mortality and recovery rate (replanting). α= Insect mortality and birth rate. ɸb= (Plants visited by insects per day) (Probability that the viruliferous insect inoculates the virus in a plant per visit). 1/k1= Time taken for the vector to inoculate the plant. 1/k2= Virus latency period in the plant. 1/k3= Infectious period of the virus in the plant. ɸT= (Plants visited by insects per day) (Time taken for the insect to sample the plant in one visit). Ex= Rate of emigration of virus-free insects. Ix= Rate of emigration of virus-free insects. Ey= Rate of emigration of latent insects. Ez= Rate of emigration of infective insects. Iy= Rate of emigration of latent insects. Iz= Rate of immigration of infective insects. 1/λ = Vector acquisition time. ɸa= (Plants visited by insects per day) (Probability that an insect will acquire the virus with a single visit to the infected plant). 1/ƞ= Time taken for the virus to transition from latent to infective within the vector (latency period). For further information, refer to Madden et al. (2000)

All the Articles

  • Open access
  • Scientific Article

Estimation of losses caused by Potato virus Y in potato crop in Coahuila

byJoel De Santiago Meza*, Gustavo Alberto Frías Treviño, Luis Alberto Aguirre Uribe, Alberto Flores Olivas

Received: 05/April/2024 – Published: 30/December/2024DOI: https://doi.org/10.18781/R.MEX.FIT.2404-2

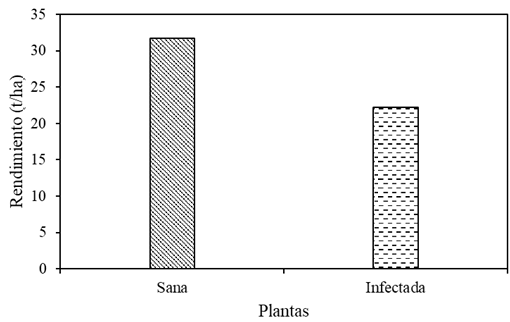
Abstract Background/Objective. The objective was to experimentally evaluate the losses caused by PVY in the Fianna variety potato crop and, consequently, estimate the losses caused by this virus in the potato-producing area of Coahuila.

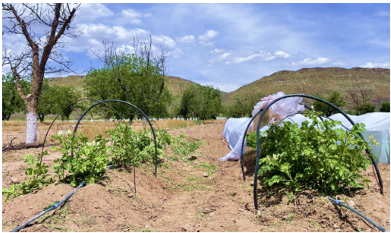
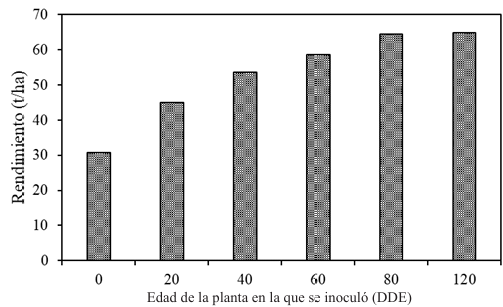
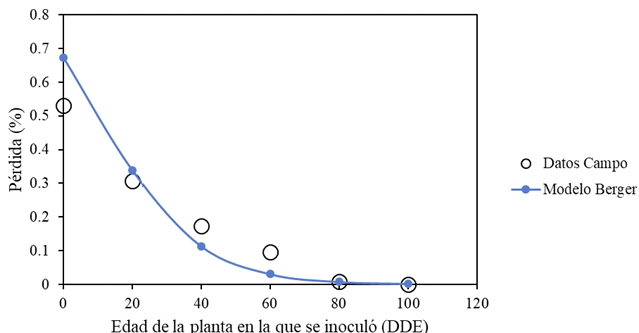
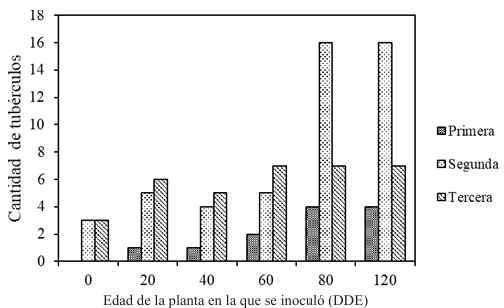
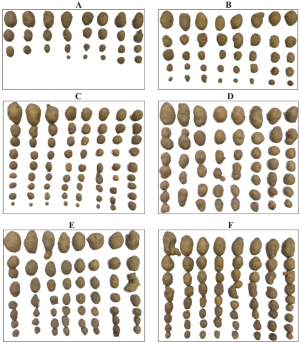
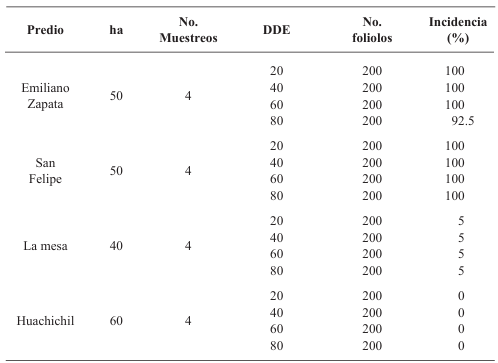
Materials and Methods. Furrows of an experimental plot planted with potato seedling and seed-tuber, were mechanically inoculated with PVY at 20, 40, 60 and 80 days after emergence. The tubers produced were harvested and losses in each treatment were evaluated. Additionally, in four commercial potato fields in this same state, leaflet samples were taken at 20, 40, 60 and 80 days after the emergence, and the percentage of plants infected with PVY was evaluated by ELISA tests. Loss data from the experimental plot and incidence data from the farms were used to develop a statistical model to estimate losses caused by PVY in the Coahuila region.

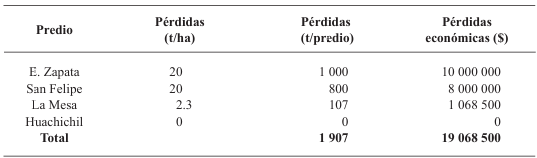
Results. Yield losses due to PVY in the experimental plot were 9.4% to 53%. The percentage of incidence of infected plants in commercial properties varied from 0% to 100%. The model that best fit the data obtained was Berger's Y=1/[1+e (-{ln[yo/(1-y0)]+r*dae})]. The estimated losses in the Coahuila region in the 2022 cycle were 18%, equivalent to $19 068500.

Conclusión: This information highlights the importance of using certified PVY-free seed and protecting the crop from emergence until 60 DAE.

Show Figures and/or Tables
Figure 1. Yield per hectare of Fianna potato plants in Assay 1.
Figure 2. Left: plants grown from tuber seed infected with PVY; right: plants grown from PVY-free tuber seed.
Figure 3. Yield per hectare of plants grown from infected tuber seed (0), plants inoculated at 20, 40, 60, and 80 DAE, and healthy plants (remained healthy throughout the 120-day cycle).
Figure 4. Fit of the Berger model explaining 98% of the variation in losses relative to the date of PVY infection (days after emergence - DAE).
Figure 5. Quantity and quality of tubers produced by plants grown from infected tuber seed (0), plants inoculated at 20, 40, 60, and 80 days after emergence (DAE), and healthy plants.
Figure 6. Tubers produced by: A) plants grown from infected tuber seed; B) plants inoculated at 20 DAE; C) plants inoculated at 40 DAE; D) plants inoculated at 60 DAE; E) plants inoculated at 80 DAE; F) healthy plants (no inoculation).
Table 1. Percentage of infected plants in commercial fields; ha = hectares, No. Samples = number of samples per field, DAE = days after emergence, No. Leaflets = number of leaflets.
Table 2. Estimated yield and economic losses in the potato-producing region of Coahuila.
  • Open access
  • Review Article

Molecular aspects of phaseolotoxin biosynthesis produced by Pseudomonas syringae pv. phaseolicola

byAlejandra Chacón López, José Luis Hernández Flores, Efigenia Montalvo González, Selene Aguilera Aguirre*

Received: 20/August/2024 – Published: 30/December/2024DOI: https://doi.org/10.18781/R.MEX.FIT.2308-2

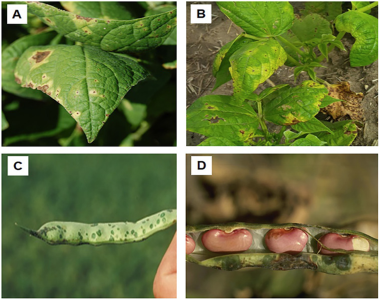
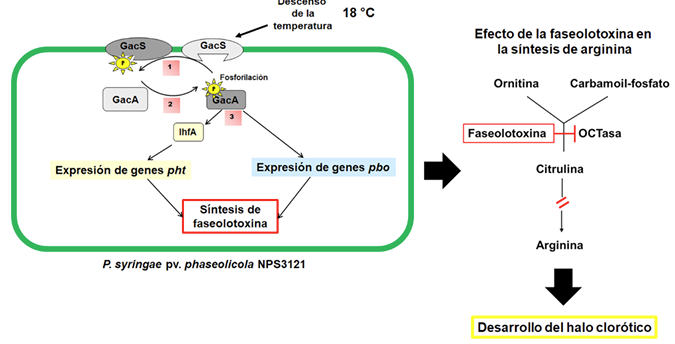
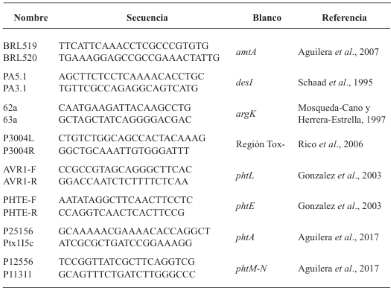
Abstract Background/Objective. Phaseolotoxin is produced by one of the most important and studied phytopathogens in the agricultural area: Pseudomonas syringae pv. phaseolicola. This bacterium causes halo blight, a disease that devastates the bean crop. The success of P. syringae pv. phaseolicola is related to its genetic information, which allows it to synthesize deleterious metabolites for its host, such as phaseolotoxin. This research aimed to analyze the molecular basis of the mechanism of action, immunity, genetics involved in the biosynthesis of phaseolotoxin, molecular diagnostic strategies, and molecular techniques developed in Mexico to manage bean halo blight.

Materials and Methods. The search and analysis of the most relevant scientific information regarding the biosynthesis of phaseolotoxin and the molecular studies of the pathogenicity and virulence factors of P. syringae pv. phaseolicola has contributed to the development of molecular strategies focused on the diagnosis and management of halo blight in beans.

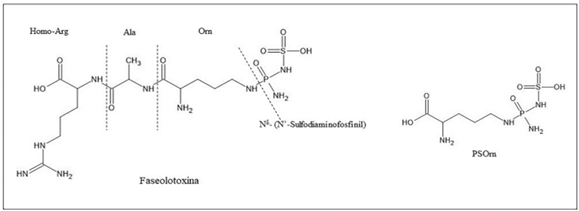
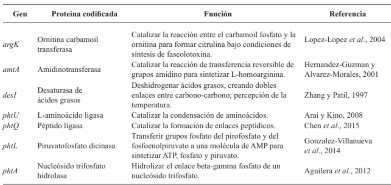
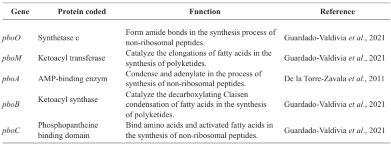
Results. P. syringae pv. phaseolicola produce phaseolotoxin, responsible for forming the chlorotic halo characteristic of halo blight, this toxin is an inhibitor of OCTase, an enzyme that participates in the arginine synthesis pathway in beans. The Pht and Pbo chromosomal regions contain genes involved in the synthesis and immunity of phaseolotoxin, and the expression of these genes is regulated by the GacS/GacA system and temperature. The identification of genes involved in the synthesis of pathogenicity and virulence factors, such as phaseolotoxin, has allowed the development of strategies for diagnosis and management of the disease based on DNA amplification and the use of molecular markers that facilitate the identification of bean cultivars resistant to the pathogen.

Conclusion. Molecular studies have contributed to understanding how the phaseolicola pathovar produces phaseolotoxin. This information has been essential to understanding how bacteria have evolved from non-pathogenic to pathogenic variants. In addition, they provide information that allows the development of new strategies for timely diagnosis and contributes to strategies for managing halo blight.

Show Figures and/or Tables
Figure 1. Symptoms produced BY P. syringae pv. phaseolicola ON bean. A Y B, Symptoms ON leaves. C Y D, Symptoms ON pods. Source: Adapted FROM Schwartz, (2008); Harveson, (2009).
Figure 2. Phaseolotoxin structure and PSOrn, product of phaseolotoxin degradation by plant peptidases.
Figure 3. Graphic representation of the Pht and Pbo Regions on <em>P. syringae</em> pv. phaseolicola chromosome. A, Pht Region operons. B, Pbo Region operons. Each arrow represents one gene, the direction of the arrow indicates the direction of transcription.
Figure 3. Graphic representation of the Pht and Pbo Regions on P. syringae pv. phaseolicola chromosome. A, Pht Region operons. B, Pbo Region operons. Each arrow represents one gene, the direction of the arrow indicates the direction of transcription.
Figure 4. Model of signaling and regulation of phaseolotoxin biosynthesis in <em>P. syringae</em> pv. phaseolicola NPS3121. Temperature is sensed by the GacS membrane sensor, which autophosphorylates therefore (1). Phosphorylated GacS transfers phosphate to the response regulator GacA (2). GacA controls the expression of <em>pht</em> genes, mediated by the IHF regulator. GacA also controls the transcription of the <em>pbo</em> genes (3). Finally, phaseolotoxin is synthesized, which inhibits bean OCTase and prevents the synthesis of arginine. Consequently, the chlorotic halo develops.
Figure 4. Model of signaling and regulation of phaseolotoxin biosynthesis in P. syringae pv. phaseolicola NPS3121. Temperature is sensed by the GacS membrane sensor, which autophosphorylates therefore (1). Phosphorylated GacS transfers phosphate to the response regulator GacA (2). GacA controls the expression of pht genes, mediated by the IHF regulator. GacA also controls the transcription of the pbo genes (3). Finally, phaseolotoxin is synthesized, which inhibits bean OCTase and prevents the synthesis of arginine. Consequently, the chlorotic halo develops.
Figure 5. Representative map of the distribution of <em>P. syringae</em> pv. <em>phaseolicola</em> in Mexico. The states marked with yellow color indicate the presence of this bacteria.
Figure 5. Representative map of the distribution of P. syringae pv. phaseolicola in Mexico. The states marked with yellow color indicate the presence of this bacteria.
Table 1. Function of <em>pht</em> genes involved in phaseolotoxin synthesis.
Table 1. Function of pht genes involved in phaseolotoxin synthesis.
Table 2. Prediction of the function of <em>pbo</em> genes involved in the phaseolotoxin synthesis.
Table 2. Prediction of the function of pbo genes involved in the phaseolotoxin synthesis.
Table 3. Oligonucleotides used to identify strains of <em>P. syringae</em> pv. <em>phaseolicola</em> producing phaseolotoxin.
Table 3. Oligonucleotides used to identify strains of P. syringae pv. phaseolicola producing phaseolotoxin.
  • Open access
  • Scientific Article

Toxicity of contact fungicides to four Trichoderma species: an in vitro compatibility approach

byConrado Parraguirre Lezama, Omar Romero Arenas*, Alba Cruz Coronel, Amparo Mauricio Gutiérrez, Carlos A Contreras Pare, Antonio Rivera Tapia

Received: 25/February/2024 – Published: 27/December/2024DOI: https://doi.org/10.18781/R.MEX.FIT.2402-7

Abstract Objective/Background. The transition towards responsible agricultural practices is essential to promote the health of agroecosystems and ensure food security. Promoting comprehensive research that combines chemical and biological methods represents a significant advance in the management of phytopathogens. This novel approach is based on the premise that the joint action between fungicides and an antagonistic agent such as Trichoderma spp. can offer robust protection compared to individual approaches. The objective of the study is to investigate the in vitro resistance and compatibility of four Trichoderma species against three fungicides widely used in Mexico.

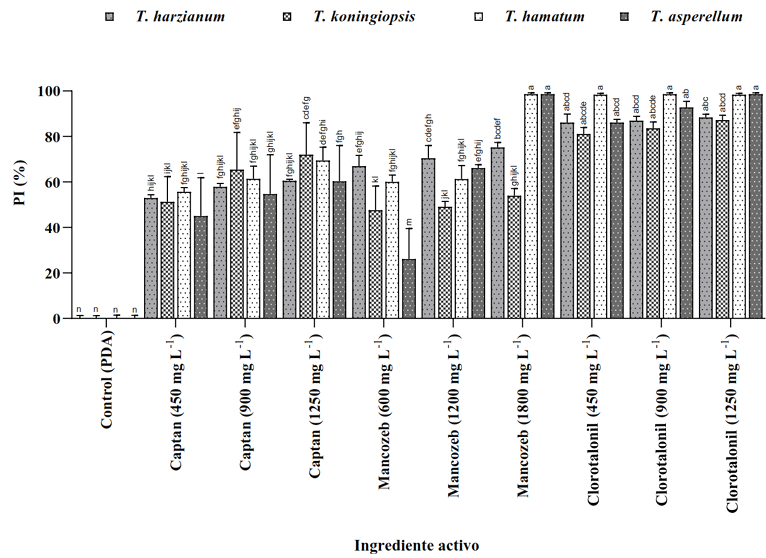
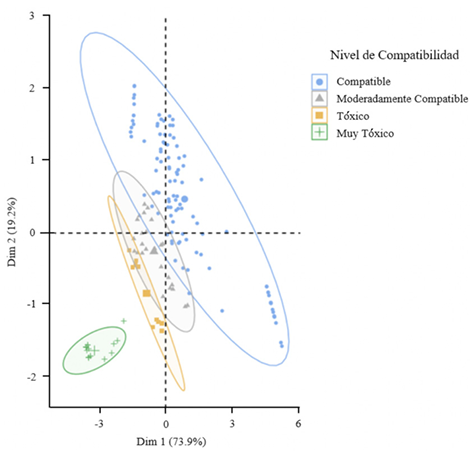
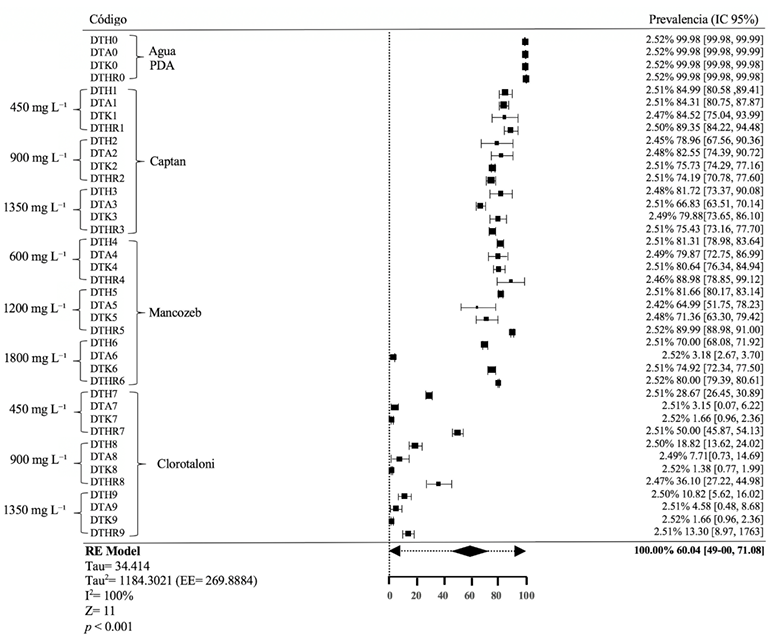
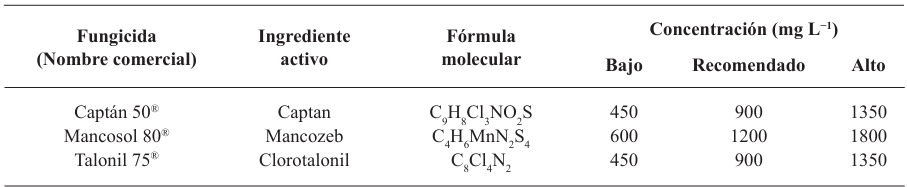
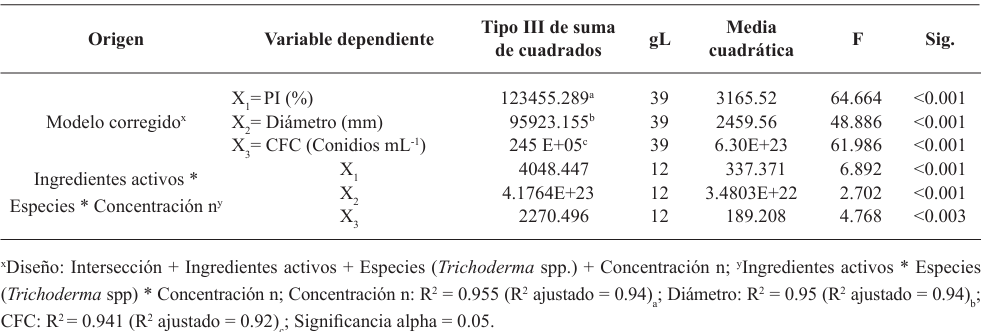
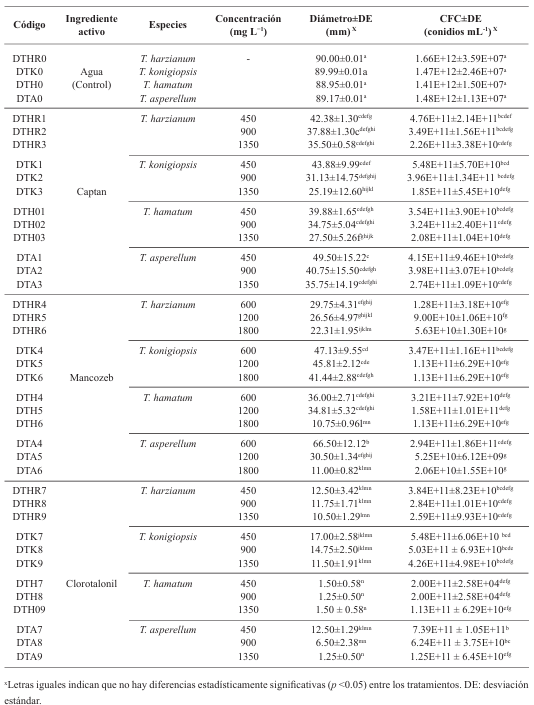
Materials and Methods. The controlled poisoning technique was used in PDA medium under controlled conditions with three concentrations (450, 900 and 1350 mg L−1) for the active ingredients Captan and Chlorothalonil, while for Mancozeb 600, 1200 and 1800 mg L−1 were used. Compatibility was determined in relation to the control group using the statistical software SPSS Statistics version 26 for the Windows operating environment.

Results. The study revealed that the strains of T. harzianum, T. hamatum, T. koningiopsis and T. asperellum exhibited an overall compatibility of 60.04% for the active ingredients evaluated, with the fungicide Captan 50® showing the highest percentage of compatibility (79.87%) at concentrations of 450, 900 and 1350 mg L–1. T. harzianum showed greater tolerance to the active ingredient Chlorothalonil at a concentration of 450 mg L-1, however, at higher concentrations it showed greater toxicity, with T. koningiopsis exhibiting the lowest resistance at its three tested concentrations.

Conclusion. Treatments with different concentrations of the fungicides Captan, Mancozeb and Chlorothalonil showed a marked variability in terms of prevalence and toxicity towards the tested Trichoderma species in vitro. This approach allows the design of integrated management strategies minimizing the dependence on chemical products and promoting compatibility between biological agents and fungicides.

Show Figures and/or Tables
Figure 1. Percentage of mycelial growth inhibition (PI) in four <em>Trichoderma</em> species at different fungicide concentrations under controlled conditions. *Identical letters indicate no statistically significant differences (p < 0.05) between treatments.
Figure 1. Percentage of mycelial growth inhibition (PI) in four Trichoderma species at different fungicide concentrations under controlled conditions. *Identical letters indicate no statistically significant differences (p < 0.05) between treatments.
Figure 2. Principal component analysis explained 93.1% of the variance in two components regarding the compatibility of four native <em>Trichoderma</em> strains at different fungicide concentrations, according to the scale established by Alves<em> et al</em>. (1998)
Figure 2. Principal component analysis explained 93.1% of the variance in two components regarding the compatibility of four native Trichoderma strains at different fungicide concentrations, according to the scale established by Alves et al. (1998)
Figure 3. Forest plot representing compatibility (C%), indicated by the means and their 95% confidence intervals, associated with each combination of strain and fungicide concentration, showing relative resistance and toxicity.
Table 1. Fungicides used at different evaluated concentrations.
Table 2. Partial multifactorial analysis of variance (MANOVA) for the effects of active ingredients, species (<em>Trichoderma</em> spp.), and concentration on the percentage of mycelial growth inhibition (PI), diameter (mm), and conidial formation capacity (CFC).
Table 2. Partial multifactorial analysis of variance (MANOVA) for the effects of active ingredients, species (Trichoderma spp.), and concentration on the percentage of mycelial growth inhibition (PI), diameter (mm), and conidial formation capacity (CFC).
Table 3. Evaluation of four <em>Trichoderma</em> species at different fungicide concentrations under controlled conditions.
Table 3. Evaluation of four Trichoderma species at different fungicide concentrations under controlled conditions.
  • Open access
  • Phytopathological note

Etiology of brown rot in strawberry (Fragaria x nanassa) in the State of Mexico

byHugo Velasco Montaño, Victoria Ayala Escobar, Daniel Téliz Ortiz, Nadia Landero Valenzuela*, Santos Gerardo Leyva Mir

Received: 07/June/2024 – Published: 27/December/2024DOI: https://doi.org/10.18781/R.MEX.FIT.2406-3

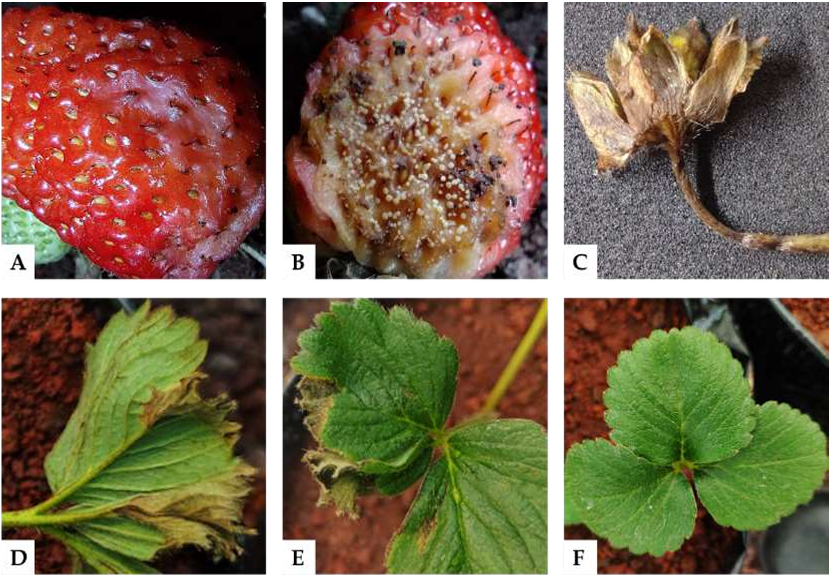
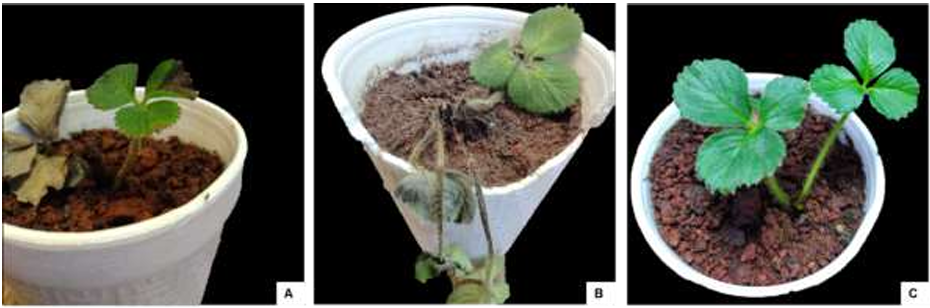
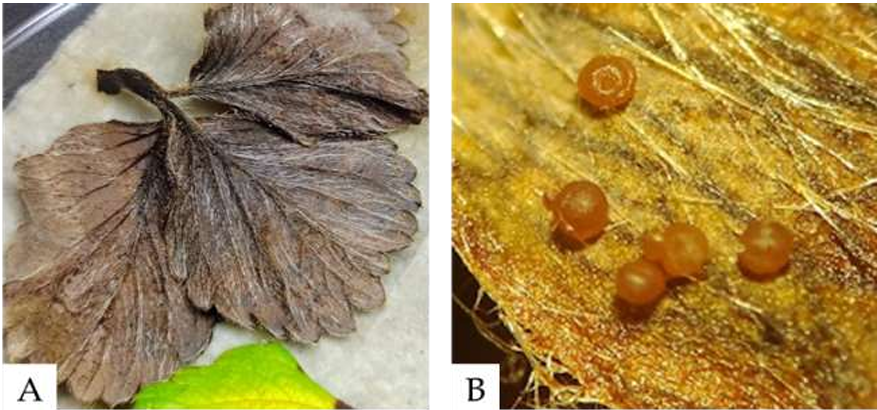
Abstract Background/Objective. In a strawberry crop established in a greenhouse in Montecillo, Texcoco, State of Mexico, in 2022, brownish brown leaf spots and rotting of fruits with asymmetric sunken lesions were observed, which extended and acquired a brown color. The objective of the present work was to identify the causal agent of brown rot in fruits and strawberry plants.

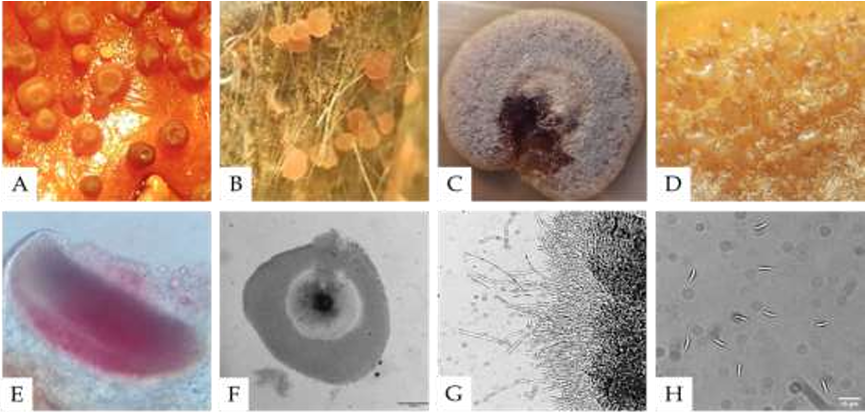
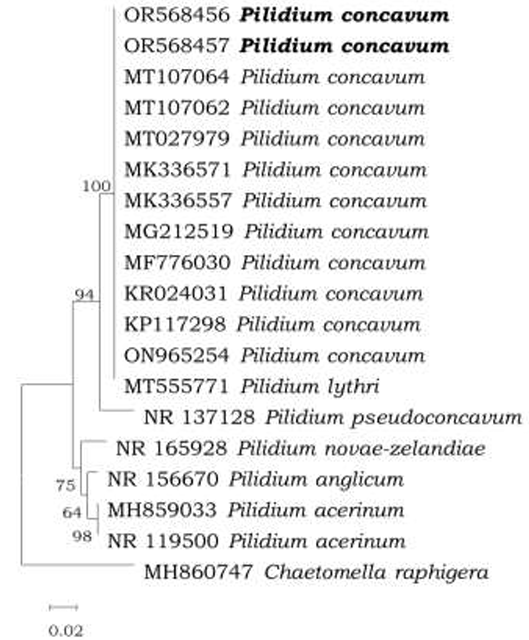
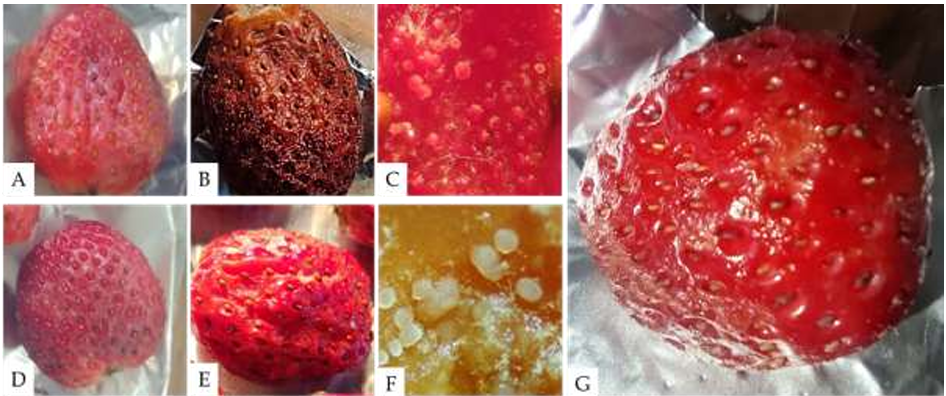
Materials and Methods. Symptomatic fruits and leaves were collected, from which fungal isolates were obtained to perform pathogenicity tests on plants and fruits, in plants by two inoculation methods: spraying via foliar and via root; in fruits by immersion. Concentrations of 2×10⁶ conidia mL-1 were used. The ITS region of the rDNA was amplified and sequenced by PCR with the universal primers ITS1-ITS4.

Results. Pilidium concavum was morphologically and molecularly identified as the causal agent of brown spot and brown rot on strawberry. It was found to be pathogenic in strawberry fruits cv. Aromas and in plants less than two months old. It showed variation in virulence, in affected plants it varied from 40 to 50%, in fruits it reached 100%.

Conclusion. The result determines that Pilidium concavum is a pathogen that produces brown leaf spot and brown rot in strawberry fruits. It allows new lines of research related to the impact of the disease on strawberry production, yield and quality in Mexico. This research is the first report of Pilidium concavum as a strawberry pathogen in the State of Mexico.

Show Figures and/or Tables
Figure 1. Visual scale for evaluating the severity of brown toasted leaf spot on strawberry. Designed by the authors.
Figure 2. A) Fruit with sunken, wet lesions. B) Fruit with brown rot and fungal structures. C) Brown constriction on the flower peduncle. D-E) Leaves with toasted brown edges. F) Healthy leaves.
Figure 3. A) Sporodochia on strawberry fruit. B) Sporodochia on the underside of the leaf. C-D) Gelatinous colony with conidial mass on PDA medium. E-F) Longitudinal and transverse sections of the sporodochium. G) Hyaline, cylindrical, filiform conidiophores. H) Hyaline, aseptate, allantoid conidia.
Figure 4. Phylogenetic tree based on Neighbor Joining of the ITS rDNA sequence, showing a phylogenetic affinity of the Mexico isolate (in bold) with <em>Pilidium concavum</em> above 95% of the node. Bar scaling 0.02 represents nucleotide substitutions per site.
Figure 4. Phylogenetic tree based on Neighbor Joining of the ITS rDNA sequence, showing a phylogenetic affinity of the Mexico isolate (in bold) with Pilidium concavum above 95% of the node. Bar scaling 0.02 represents nucleotide substitutions per site.
Figure 5. Pathogenicity tests on strawberry fruit inoculated with a concentration of 2×10<sup>6</sup> conidia mL<sup>−1</sup> of <em>Pilidium concavum</em>. A) Fruit with a wound inoculated with the fungus. B) Wounded fruit showing symptoms 72 hours post-inoculation (hpi). C) Sporodochia of the fungus on the wounded fruit. D) Unwounded fruit inoculated with the fungus. E) Unwounded fruit showing symptoms 96 hours post-inoculation. F) Sporodochia of the fungus on the unwounded fruit. G) Control inoculated with sterile distilled water, showing no symptoms at 96 hours post-inoculation.
Figure 5. Pathogenicity tests on strawberry fruit inoculated with a concentration of 2×10⁶ conidia mL−1 of Pilidium concavum. A) Fruit with a wound inoculated with the fungus. B) Wounded fruit showing symptoms 72 hours post-inoculation (hpi). C) Sporodochia of the fungus on the wounded fruit. D) Unwounded fruit inoculated with the fungus. E) Unwounded fruit showing symptoms 96 hours post-inoculation. F) Sporodochia of the fungus on the unwounded fruit. G) Control inoculated with sterile distilled water, showing no symptoms at 96 hours post-inoculation.
Figure 6. Strawberry plants (<em>Fragaria</em> x <em>ananassa</em>) cv. Aromas less than three months old, 15 days post-inoculation (dpi) with a suspension of 2x10<sup>6</sup> conidia per mL of <em>Pilidium concavum</em>. A) Inoculated via foliar; B) Inoculated via root routes; C) Control inoculated with sterile distilled water. 
Figure 6. Strawberry plants (Fragaria x ananassa) cv. Aromas less than three months old, 15 days post-inoculation (dpi) with a suspension of 2x10⁶ conidia per mL of Pilidium concavum. A) Inoculated via foliar; B) Inoculated via root routes; C) Control inoculated with sterile distilled water. 
Figure 7. A) Asymptomatic strawberry leaves after 28 days post-inoculation (dpi), placed in a humid chamber. B) Formation of sporodochia on the leaves after 5 days in the humid chamber.
  • Open access
  • Scientific Article
  • Número Especial

Potential biological control Mechanisms of Bacillus paralicheniformis TRQ65 against phytopathogenic fungi

byValeria Valenzuela Ruiz, Fannie Isela Parra Cota, Gustavo Santoyo, María Isabel Estrada Alvarado, Luis Alberto Cira Chávez, Ernestina Castro Longoria, Sergio de los Santos Villalobos*

Received: 01/July/2024 – Published: 18/December/2024DOI: https://doi.org/10.18781/R.MEX.FIT.2024-18

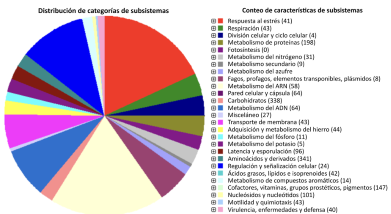
Abstract Background/Objetive. Bacillus paralicheniformis TRQ65 was isolated from wheat (Triticum turgidum subsp. durum) rhizosphere in commercial fields in the Yaqui Valley, Mexico. This strain was one of the most abundant bacteria in the rhizosphere. The objective of this study is to explore the potential biological control action mechanisms of Bacillus paralicheniformis TRQ65 against phytopathogenic fungi of agricultural importance, through genome sequencing and mining.

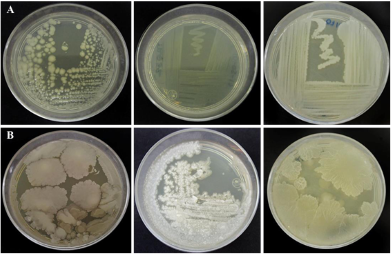
Materials and methods. The biocontrol activity of this strain was quantified through in vitro dual assays evaluating inhibition zones against 11 agronomically important fungi. A whole-genome analysis was conducted as genomic mining to evaluate its potential for biological control.

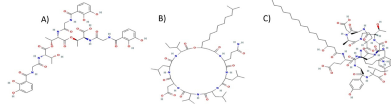
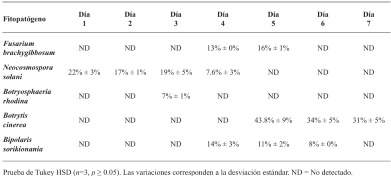
Results. Strain TRQ65 showed biocontrol activity against 45% of the studied fungi, where the highest inhibition was against Botrytis cinerea, 43.8% ± 9% on day 5. Based on genome sequencing and mining (antiSMASH), this bioactivity could be associated with the biosynthesis of lichenysin, bacillibactin, and/or fengycin.

Conclusion. This research provides the first insight into the potential biological control activity of strain TRQ65. Further studies need to be carried out to validate Bacillus paralicheniformis TRQ65 as an active ingredient in sustainable bacterial inoculants for eco-friendly agriculture.

Show Figures and/or Tables
Figure 1. Subsystem category distribution of coding DNA sequences (CDS) in the <em>B. paralicheniformis</em> TRQ65 genome, following the RAST pipeline.
Figure 1. Subsystem category distribution of coding DNA sequences (CDS) in the B. paralicheniformis TRQ65 genome, following the RAST pipeline.
Figure 2. A) Bacillibactin structure (National Center for Biotechnology Information, 2024). Bacillibactin is builtaround a trilactone core formed by the cyclization of three molecules of 2,3-dihydroxybenzoic acid (DHB) linked to a central scaffold of threonine residues. The trilactone ring is formed through ester bonds between the hydroxyl groups of the threonine and the carboxyl groups of DHB. Each DHB moiety in bacillibactin contains catechol (2,3-dihydroxybenzoate) functional groups. These catechol groups are responsible for the high-affinity binding of Fe³⁺. B) Lichenysin structure (National Center for Biotechnology Information, 2024). Lichenysin contains a cyclic peptide ring consisting of 13 amino acid residues. Attached to the cyclic peptide core is a lipid tail, typically a β-hydroxy fatty acid chain.The peptide chain forms a cyclic structure through an amide bond between the carboxyl group of one amino acid and the amine group of another, creating a stable ring structure. C) Fengycin structure (National Center for Biotechnology Information, 2024). Fengycin consists of a decapeptide forming a cyclic structure through a lactone linkage. Attached to the peptide ring is a β-hydroxy fatty acid, which can vary in length, usually between 14 and 18 carbon atoms. The exact sequence of amino acids can vary slightly depending on the specific isoform of fengycin.
Table 1. Inhibition zone (percentage) of <em>Bacillus paralicheniformis</em> TRQ65 against agriculturally important fungal plant pathogens.
Table 1. Inhibition zone (percentage) of Bacillus paralicheniformis TRQ65 against agriculturally important fungal plant pathogens.
  • Open access
  • Scientific Article
  • Número Especial

Mitigating Chili Plant Wilt: Synergy of Arbuscular Mycorrhizal Fungi and Silver Nanoparticles

byHilda Karina Sáenz Hidalgo, Esteban Sánchez Chávez, Nuvia Orduño Cruz, Mahendra Rai, Víctor Olalde Portugal, Graciela Dolores Ávila Quezada*

Received: 17/June/2024 – Published: 13/December/2024DOI: https://doi.org/10.18781/R.MEX.FIT.2024-8

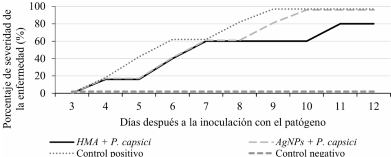
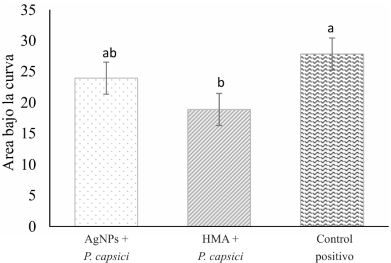
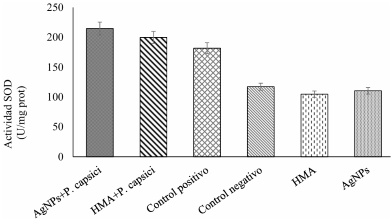
Abstract Background/Objective. The chilaca pepper (Capsicum annuum) is significantly impacted by the attack of the oomycete Phytophthora capsici, which causes chili wilt. Current methods for controlling this disease have been inefficient. Therefore, the search for more environmentally friendly alternatives is of great importance. In pursuit of this objective, we assessed the potential of arbuscular mycorrhizal fungi (AMF) and silver nanoparticles (AgNPs) to try to reduce or postpone chili pepper wilt.

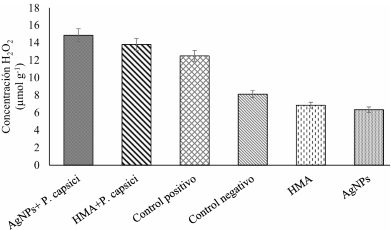
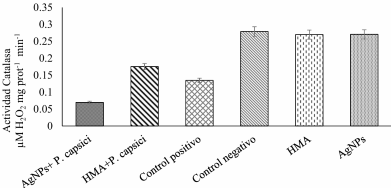
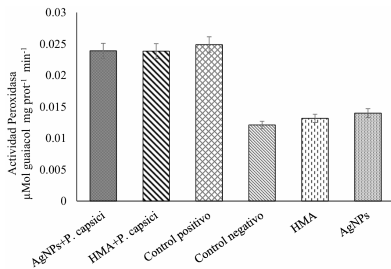
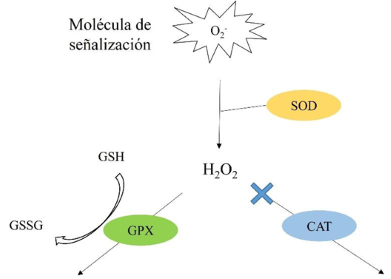
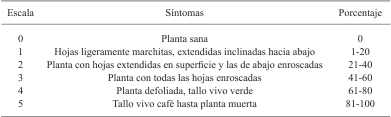
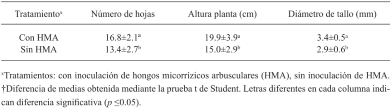
Materials and Methods.Growth parameters were measured in inoculated and non-inoculated chili pepper plants with AMF from a commercil consortium TM-73 (Biotecnología Microbiana) and the protective effects of AMF and AgNPs (NanoID®) against P. capsici as evaluated using a severity scale for wilt symptoms. Plant response to pathogen infection was assessed by measuring the activities of antioxidant enzymes: PER, SOD, CAT and H2O2.

Results. The results indicated that AMF application improved the growth parameters of C. annuum, while the plant-pathogen interaction induced an antioxidant enzymatic response. AMF maintained wilt symptoms at or below 80%, preventing plant death. Meanwhile, AgNPs (50ppm) delayed plant mortality compared to the control treatment.

Conclusion. The combined use of AMF and AgNPs offer options for future research in the disease management for chili peppers.

Show Figures and/or Tables
Figure 1. Mycorrhizal structures in chilaca pepper roots inoculated with AMF: A, B, C) Hyphae (H) and Vesicles (V), d) Arbuscules (A).
Figure 2. Percentage of severity of the disease caused by <em>P. capsici</em> in chilaca peppers. Severity was evaluated with a scale for 12 days after the inoculation of the pathogen.
Figure 2. Percentage of severity of the disease caused by P. capsici in chilaca peppers. Severity was evaluated with a scale for 12 days after the inoculation of the pathogen.
Figure 3. Comparison of averages of the area under the curve of the scale of severe diseases caused by <em>P. capsici</em> in chilaca peppers. Standard error 5%. Different letters in each column indicate a significant difference (p ≤0.05).
Figure 3. Comparison of averages of the area under the curve of the scale of severe diseases caused by P. capsici in chilaca peppers. Standard error 5%. Different letters in each column indicate a significant difference (p ≤0.05).
Figure 4. Superoxide dismutase (SOD) activity in chilaca pepper plants inoculated with <em>P. capsici</em> treated with AMF and AgNPs. Same letters in each column indicate there were no significant differences (p >0.05).
Figure 4. Superoxide dismutase (SOD) activity in chilaca pepper plants inoculated with P. capsici treated with AMF and AgNPs. Same letters in each column indicate there were no significant differences (p >0.05).
Figure 5. Concentration of H<sub>2</sub>O<sub>2</sub> in chilaca pepper plants inoculated with <em>P. capsici</em> treated with AMF and AgNPs. Same letters in each column indicate there were no significant differences (p >0.05).
Figure 5. Concentration of H2O2 in chilaca pepper plants inoculated with P. capsici treated with AMF and AgNPs. Same letters in each column indicate there were no significant differences (p >0.05).
Figure 6. Catalase (CAT) activity in chilaca peppers inoculated with <em>P. capsici</em> treated with AMF and AgNPs. Same letters in each column indicate there were no significant differences (p > 0.05).
Figure 6. Catalase (CAT) activity in chilaca peppers inoculated with P. capsici treated with AMF and AgNPs. Same letters in each column indicate there were no significant differences (p > 0.05).
Figure 7. Peroxidase (PER) activity in chilaca pepper plants inoculated with <em>P. capsici</em> treated with AMF and AgNPs. Same letters in each column indicate there were no significant differences (p >0.05).
Figure 7. Peroxidase (PER) activity in chilaca pepper plants inoculated with P. capsici treated with AMF and AgNPs. Same letters in each column indicate there were no significant differences (p >0.05).
Figure 8. Effect on the enzyme activity in chilaca pepper plants inoculated with <em>P. capsici</em>. Superoxide Dismutase (SOD), Catalase (CAT), Peroxidase (PER).
Figure 8. Effect on the enzyme activity in chilaca pepper plants inoculated with P. capsici. Superoxide Dismutase (SOD), Catalase (CAT), Peroxidase (PER).
Table 1. Scale of severity of wilting by <em>P. capsici</em> in <em>C. annuum</em>.
Table 1. Scale of severity of wilting by P. capsici in C. annuum.
Table 2. Effect of AMF in the development of the chilaca pepper (<em>Capsicum annuum</em>).
Table 2. Effect of AMF in the development of the chilaca pepper (Capsicum annuum).
  • Open access
  • Phytopathological note
  • Número Especial

In vitro evaluation mycoparasitic capacity of Irpex lacteus P7B against fungi and oomycetes associated with plant diseases

byFrancisco Palemón Alberto, Santo Ángel Ortega Acosta*, Erubiel Toledo Hernández, Cesár Sotelo Leyva, Guadalupe Reyes García, Elizabeth Tecomulapa Acatitlán

Received: 07/July/2024 – Published: 04/December/2024DOI: https://doi.org/10.18781/R.MEX.FIT.2024-21

Abstract Background/Objective. Diseases of agricultural crops affect the yields and quality of products. Synthetic chemical compounds are generally used to control them; these cause harmful impacts to the environment, as well as to human health. In this sense, beneficial microorganisms can be used in agriculture as biocontrol agents, and contribute to obtaining food in sufficient and safe quantities. The fungus Irpex lacteus has been reported as a potential biocontrol agent. The objective of this research work was to evaluate the in vitro mycoparasitic capacity of the endophytic fungus I. lacteus P7B against 22 fungi and one oomycete associated with plant diseases.

Materials and Methods. The P7B isolate, previously detected as a mycoparasite, was used and molecularly identified by amplification and sequencing of the internal transcribed spacer (ITS) region of ribosomal DNA, using primers ITS1/ ITS4.The confrontations of the mycoparasite (P7B) against the phytopathogenic microorganisms were carried out in PDA culture medium. Three replicates were used for each microorganism, in addition to the controls, which consisted of placing the microorganisms individually.

Results. Molecular analyses determined that isolate P7B corresponded to Irpex lacteus (GenBank: PP922180). The results of the in vitro assays indicated that I. lacteus P7B inhibited all the phytopathogenic agents with which it was confronted, 100% inhibition by I. lacteus occurred approximately in 14 days, except for Rhizopus spp., this was at 23 days after the confrontations.

Conclusion. The present study demonstrates that the fungus I. lacteus presented 100% in vitro mycoparasitic capacity against the various fungi and an oomycete evaluated, so future work could focus on evaluating its mycoparasitic activity under field conditions.

Show Figures and/or Tables
Figure 1. Effect of the confrontation in dual culture in PDA under <em>in vitro</em> conditions between <em>I. lacteus</em> P7B against fungi and an oomycete associated to plant diseases.
Figure 1. Effect of the confrontation in dual culture in PDA under in vitro conditions between I. lacteus P7B against fungi and an oomycete associated to plant diseases.
Figure 3. Effect of the confrontation in dual culture in PDA under <em>in vitro</em> conditions between <em>I. lacteus</em> P7B against fungi and an oomycete associated to plant diseases. P7B = <em>Irpex lacteus</em>. CC47GRO = <em>Corynespora cassiicola</em>. COLTOR1 = <em>Colletotrichum gloeosporioides</em>. PAP-4= <em>Phytophthora</em> sp. C4 = <em>Macrophomina</em> sp. RIZOPAP = <em>Rhizopus</em> sp. Dac = Days after confrontation.
Figure 3. Effect of the confrontation in dual culture in PDA under in vitro conditions between I. lacteus P7B against fungi and an oomycete associated to plant diseases. P7B = Irpex lacteus. CC47GRO = Corynespora cassiicola. COLTOR1 = Colletotrichum gloeosporioides. PAP-4= Phytophthora sp. C4 = Macrophomina sp. RIZOPAP = Rhizopus sp. Dac = Days after confrontation.
Figure 3. Effect of the confrontation in vitro of <em>I. lacteus</em> P7B against fungi and an oomycete. A= <em>Macrophomina</em> sp. (isolate C4) control; B= Macrophomina sp. (isolate C4) confronted with <em>I. lacteus</em> P7B, a degradation of sclerotia and hyphae can be observed. C = <em>Alternaria</em> sp. (isolate AL1) control; D = <em>Alternaria</em> sp. (isolate AL1) confronted with I. lacteus P7B, in which a degradation of conidia and hyphae can be observed. E = <em>Rhizopus</em> sp. (isolate RIZOPAP) control; F = <em>Rhizopus</em> sp. (isolate RIZOPAP) confronted with <em>I. lacteus</em> P7B, shows degraded sporangia. Images captured with anoptic microscope with 10X (A, B, E and F), and 40X objective lens (C and D).
Figure 3. Effect of the confrontation in vitro of I. lacteus P7B against fungi and an oomycete. A= Macrophomina sp. (isolate C4) control; B= Macrophomina sp. (isolate C4) confronted with I. lacteus P7B, a degradation of sclerotia and hyphae can be observed. C = Alternaria sp. (isolate AL1) control; D = Alternaria sp. (isolate AL1) confronted with I. lacteus P7B, in which a degradation of conidia and hyphae can be observed. E = Rhizopus sp. (isolate RIZOPAP) control; F = Rhizopus sp. (isolate RIZOPAP) confronted with I. lacteus P7B, shows degraded sporangia. Images captured with anoptic microscope with 10X (A, B, E and F), and 40X objective lens (C and D).
Table 1. Microorganisms used in the evaluation for the confrontation with <em>Irpex lacteus</em> P7B from the collection of pyhtopathogenic fungi of the Plant Physiology and Biotechnology Laboratory, FCAA-UAGro.
Table 1. Microorganisms used in the evaluation for the confrontation with Irpex lacteus P7B from the collection of pyhtopathogenic fungi of the Plant Physiology and Biotechnology Laboratory, FCAA-UAGro.
  • Open access
  • Scientific Article
  • Número Especial

Isolation and characterization of Exserohilum turcicum, and its in vitro inhibition by volatile organic compounds produced by rhizobacteria

byEstefanía Fonseca Chávez, Irvin Alonso Molina Marañón, Luz Irela Lugo Zambrano, Juan Carlos Martínez Álvarez, Guadalupe Arlene Mora Romero, Jesús Damián Cordero Ramírez, Karla Yeriana Leyva Madriga*

Received: 01/July/2024 – Published: 04/December/2024DOI: https://doi.org/10.18781/R.MEX.FIT.2024-14

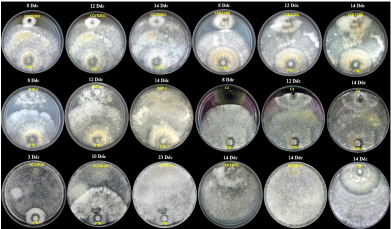
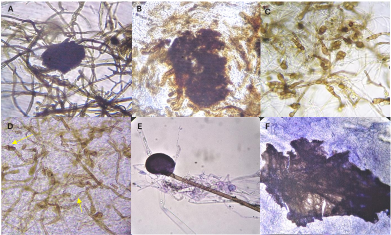
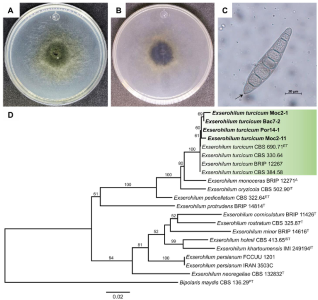
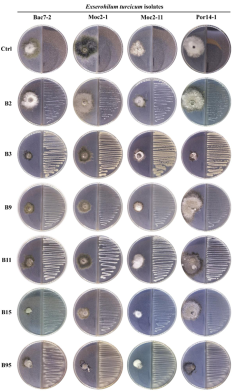
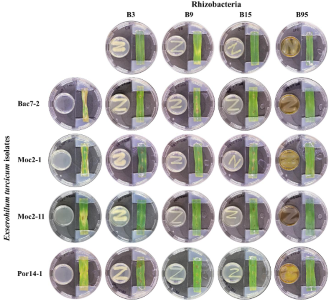
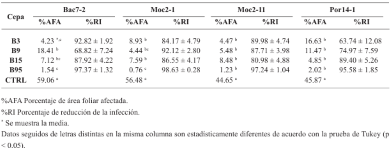
Abstract Background/Objective. Biological control offers new strategies for disease management in agriculture. In the present study, the antifungal activity of volatile organic compounds (VOCs) emitted by rhizobacteria, was evaluated in the growth and infective capacity of four isolates of E. turcicum obtained from symptomatic corn plants, in northern Sinaloa.

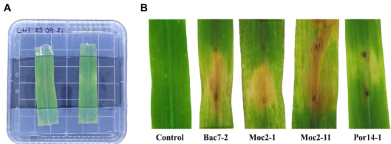
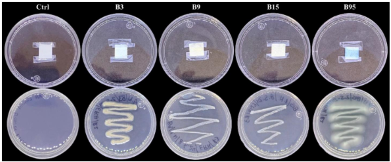
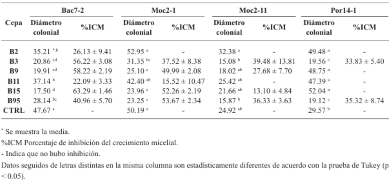
Materials y methods. The fungal isolates were characterized morphologically and molecularly, and their pathogenicity was corroborated in a detached leaf assay. The ability of VOCs to inhibit mycelial growth and infection of maize leaves by E. turcicum was evaluated in in vitro assays, in divided Petri dishes. Bacterial hydrogen cyanide production was qualitatively determined.

Results. The mycelial growth of E. turcicum was reduced by VOCs of at least one rhizobacteria, registering inhibitions between 22% and 63%. Leaves infection was reduced between 63% and 98% in the presence of rhizobacterial VOCs. Hydrogen cyanide production was detected in strains B3 and B9.

Conclusion. Strain B95 was more effective in reducing mycelial growth and infection by E. turcicum. The production of hydrogen cyanide could be involved in its antagonistic effect. In-plant tests are required to corroborate its effectiveness, as well as characterize its volatile profile.

Show Figures and/or Tables
Figure 1. Characterization of Exserohilum turcicum isolates. <strong>A-C)</strong> Morphological characteristics of representative isolate Bac7-2. A) Frontal view of the culture in PDA; <strong>B)</strong> Reverse view of the culture in PDA; <strong>C)</strong> Conidium; <strong>D)</strong> Maximum Likelihood phylogram inferred from the combined matrix of the markers act+ITS+rpb2 from Exserohilum.
Figure 1. Characterization of Exserohilum turcicum isolates. A-C) Morphological characteristics of representative isolate Bac7-2. A) Frontal view of the culture in PDA; B) Reverse view of the culture in PDA; C) Conidium; D) Maximum Likelihood phylogram inferred from the combined matrix of the markers act+ITS+rpb2 from Exserohilum.
Figure 2. Pathogenicity test. <strong>A)</strong> Detached leaf system used to confirm the pathogenicity; <strong>B)</strong> Symptoms caused by the <em>Exserohilum turcicum</em> isolates in the detached maize leaves.
Figure 2. Pathogenicity test. A) Detached leaf system used to confirm the pathogenicity; B) Symptoms caused by the Exserohilum turcicum isolates in the detached maize leaves.
Figure 3. Effect of the bacterial volatile organic compounds on the mycelial growth of <em>Exserohilum turcicum</em> in divided Petri dishes.
Figure 3. Effect of the bacterial volatile organic compounds on the mycelial growth of Exserohilum turcicum in divided Petri dishes.
Figure 4. Effect of the bacterial volatile organic compounds on the infective capacity of <em>Exserohilum turcicum</em> on detached maize leaves.
Figure 4. Effect of the bacterial volatile organic compounds on the infective capacity of Exserohilum turcicum on detached maize leaves.
Figure 5. Detection of volatile hydrocyanic acid emitted by rhizobacteria.
Table 1. Effect of the bacterial volatile organic compounds (VOCs) on the mycelial growth of <em>Exserohilum turcicum</em> in divided plates.
Table 1. Effect of the bacterial volatile organic compounds (VOCs) on the mycelial growth of Exserohilum turcicum in divided plates.
Table 2. Effect of the bacterial volatile organic compounds (VOCs), in the infective capacity of <em>Exserohilum turcicum</em> in detached maize leaves.
Table 2. Effect of the bacterial volatile organic compounds (VOCs), in the infective capacity of Exserohilum turcicum in detached maize leaves.
  • Open access
  • Scientific Article
  • Número Especial

Biological effectiveness of Agave striata and Fouquieria splendens extracts against Pythium aphanidermatum and Rhizoctonia solani in vitro

byJesús Eduardo Ramírez Méndez, Francisco Daniel Hernández Castillo, Gabriel Gallegos Morales, Diana Jasso Cantú, Roberto Arredondo Valdés, Marco Antonio Tucuch Pérez*

Received: 02/July/2024 – Published: 23/November/2024DOI: https://doi.org/10.18781/R.MEX.FIT.2024-23

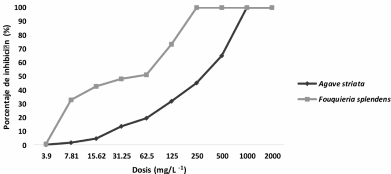
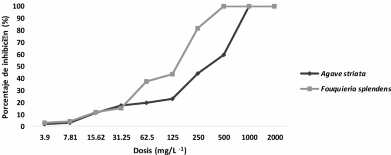
Abstract Background/Objective. Pythium aphanidermatum and Rhizoctonia solani are pathogens that affect agricultural crops. The objective of this study was to evaluate some Agave striata and Fouquieria splendens methanolic extracts, from the Chihuahuan Desert, against those fungi, in search for biological control alternatives.

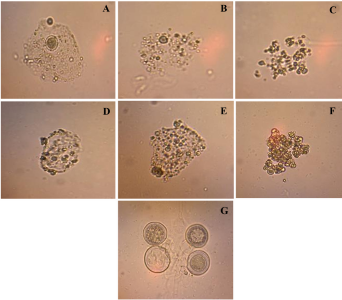
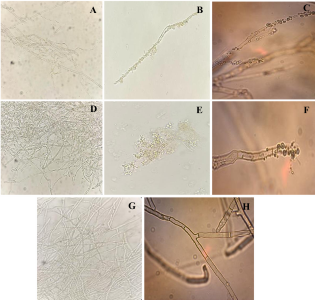
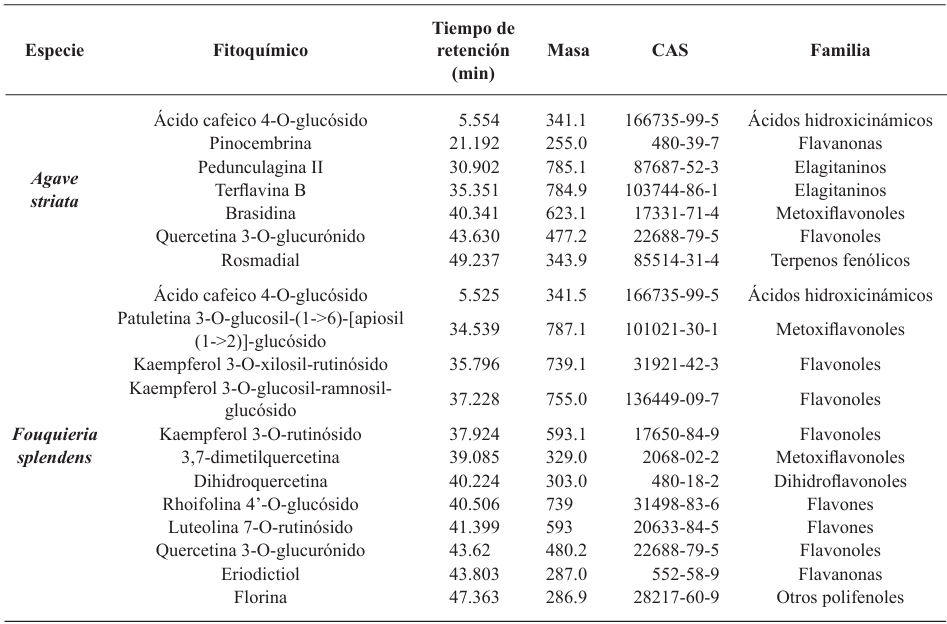
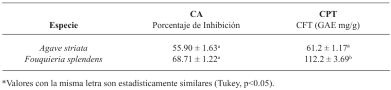
Materials and Methods. Pathogens from chili plants were isolated and identified using morphological and molecular methods. Methanolic extracts from both plants were prepared, and the antioxidant capacity (AC), the total polyphenol content (TPC), and the antifungal compounds via HPLC-MS were assessed. The antifungal effectiveness was tested at concentrations of 3.9-2000 mg L-1 using a poisoned medium assay, where fungi structural damage was observed.

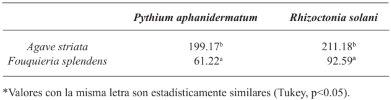
Results. The F. splendens and A. striata extracts exhibited 55% and 68% AC, as well as 61 mg/g and 112 mg/g TPC, respectively. Both extracts contained caffeic acid and quercetin, while F. splendens also exhibited eriodyctiol, kaempferol, and luteolin; A. striata contained pinocembrin and theaflavin B. F. splendens attained 100% inhibition of P. aphanidermatum at 250 mg L-1, and of R. solani at 500 mg L-1, whereas A. striata achieved 100% inhibition at 1000 mg L-1 in both cases. The extracts produced lysis in P. aphanidermatum oogonia and mycelial fragmentation in R. solani.

Conclusion. The F. splendens and A. striata methanolic extracts demonstrate promising antifungal activity against P. aphanidermatum and R. solani, suggesting that these natural compounds might be useful as a biological alternative for pathogen control in agricultural crops.

Show Figures and/or Tables
Figure 1. Inhibition of <em>Pythium aphanidermatum</em> with methanolic <em>Agave striata</em> and <em>Fouquieria splendens</em> extracts using the poisoned medium method.
Figure 1. Inhibition of Pythium aphanidermatum with methanolic Agave striata and Fouquieria splendens extracts using the poisoned medium method.
Figure 2. Inhibition of <em>Rhizoctonia solani</em> using plant <em>Agave striata</em> and <em>Fouquieria splendens</em> extracts using the poisoned medium method.
Figure 2. Inhibition of Rhizoctonia solani using plant Agave striata and Fouquieria splendens extracts using the poisoned medium method.
Figure 3. Effect of plant extracts on <em>Pythium aphanidermatum</em> oogonia at 100X. A, B and C) <em>Fouquieria splendens</em>, D, E and F) <em>Agave striata</em>, and G) Negative control.
Figure 3. Effect of plant extracts on Pythium aphanidermatum oogonia at 100X. A, B and C) Fouquieria splendens, D, E and F) Agave striata, and G) Negative control.
Figure 4. Effect of plant extracts on mycelial <em>Rhizoctonia solani</em> structures at 40X and 100X. A, B, C) <em>Fouquieria splendens</em>, D, E, F) <em>Agave striata</em>, and G), H) Negative control.
Figure 4. Effect of plant extracts on mycelial Rhizoctonia solani structures at 40X and 100X. A, B, C) Fouquieria splendens, D, E, F) Agave striata, and G), H) Negative control.
Table 1. Phytochemical compounds identified in methanolic <em>Agave striata</em> and <em>Fouquieria splendens</em> extracts characterized by reverse-phase liquid chromatography (HPLC-MS).
Table 1. Phytochemical compounds identified in methanolic Agave striata and Fouquieria splendens extracts characterized by reverse-phase liquid chromatography (HPLC-MS).
Table 2. Antioxidant Capacity and Capacity of Total Polyphenols of methanolic <em>Agave striata</em> and <em>Fouquieria splendens</em> extracts.
Table 2. Antioxidant Capacity and Capacity of Total Polyphenols of methanolic Agave striata and Fouquieria splendens extracts.
Table 3. Inhibitory concentration at 50% (IC<sub>50</sub>) of methanolic <em>Agave striata</em> and <em>Fouquieria splendens</em> extracts on <em>Pythium aphanidermatum</em> and <em>Rhizoctonia solani</em>.
Table 3. Inhibitory concentration at 50% (IC50) of methanolic Agave striata and Fouquieria splendens extracts on Pythium aphanidermatum and Rhizoctonia solani.
  • Open access
  • Review Article
  • Número Especial

The genus Bacillus as biological control agent against pests and pathogens for sustainable agriculture

byFannie Isela Parra Cota, Isabeli Bruno, Mónica García Montelongo, Sebastián González Villarreal, María Fernanda Villarreal Delgado, Liliana Carolina Córdova Albores, Alina Escalante Beltrán, Sergio de los Santos Villalobos*

Received: 10/July/2024 – Published: 19/November/2024DOI: https://doi.org/10.18781/R.MEX.FIT.2024-34

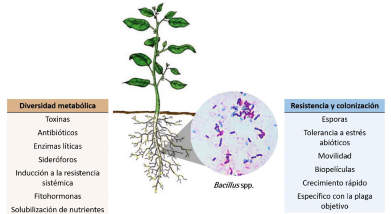
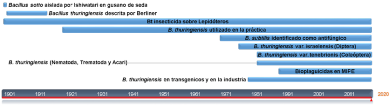
Abstract Background/Objective. Bacteria of the Bacillus genus have been studied since their discovery in 1872, for their ability to synthesize metabolites of interest such as proteins used to control phytopathogens. The objective of this research was to analyze the most outstanding species of the Bacillus genus, as well as the main compounds produced by these species, and the perspectives on the use of this bacterial genus for pest and disease control.

Materials and Methods. An exhaustive search was carried out in scientific articles and books to gather the most relevant information regarding the Bacillus genus, focusing on its role as a biological control agent for pests and pathogens.

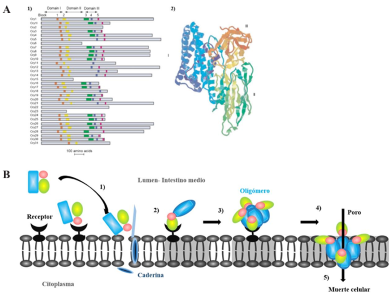
Results. The Bacillus genus includes more than 427 taxa, which can be classified into different groups. Among the biological control agents (BCA) are the Bacillus cereus group, which includes B. cereus, B. anthracis, and B. thuringiensis, and the B. subtilis group, which includes B. subtilis, B. licheniformis, and B. pumilus, mainly. B. thuringiensis, through cry genes, has molecular mechanisms to synthesize a crystalline inclusion during sporulation, which contains proteins known as endotoxins or Cry proteins. B. subtilis produces substances with a high potential for biological control, such as volatile organic compounds, as well as bioactive secondary metabolites.

Conclusion. The potential of the Bacillus genus to be used as biological control agents is evident. They are widely used for the development of different biopesticides that have advantages over other products. However, it is necessary to continue conducting research from the in vitro area in the laboratory to the field, to help guarantee their biosecurity and effectiveness.  

Show Figures and/or Tables
Figure 1. Macroscopic characteristics of <em>Bacillus cereus</em> (<strong>A</strong>) and <em>B. subtilis</em> (<strong>B</strong>), belonging to the Culture Collection of Native Soil and Endophytic Microorganisms, grown at 28 °C in nutrient agar (COLMENA (www.itson.edu.mx/COLMENA) (de los Santos-Villalobos et al., 2018).
Figure 1. Macroscopic characteristics of Bacillus cereus (A) and B. subtilis (B), belonging to the Culture Collection of Native Soil and Endophytic Microorganisms, grown at 28 °C in nutrient agar (COLMENA (www.itson.edu.mx/COLMENA) (de los Santos-Villalobos et al., 2018).
Figure 2. Cry proteins. 1-A) Primary structure, showing the organization of the domains of representative members from each Cry family, 2-A) Conserved tertiary structure, showing the positions of the three domains. B) Mechanism of action of Cry proteins in insects, initiating once the Cry proteins are proteolytically processed by proteases in the midgut of the host, separating an amino acid section in the N-terminal region and at the C-terminal end (depending on the nature of the Cry protein), thus releasing active and toxic fragments that interact with receptor proteins in the insect’s intestinal cells. Modified from Villarreal-Delgado <em>et al</em>., 2018.; de Maagd <em>et al</em>., 2001; Xu <em>et al</em>., 2014.
Figure 2. Cry proteins. 1-A) Primary structure, showing the organization of the domains of representative members from each Cry family, 2-A) Conserved tertiary structure, showing the positions of the three domains. B) Mechanism of action of Cry proteins in insects, initiating once the Cry proteins are proteolytically processed by proteases in the midgut of the host, separating an amino acid section in the N-terminal region and at the C-terminal end (depending on the nature of the Cry protein), thus releasing active and toxic fragments that interact with receptor proteins in the insect’s intestinal cells. Modified from Villarreal-Delgado et al., 2018.; de Maagd et al., 2001; Xu et al., 2014.
Figure 3. Characteristics of interest of <em>Bacillus</em> spp. for the formulation of bioinoculants.
Figure 3. Characteristics of interest of Bacillus spp. for the formulation of bioinoculants.
Figure 4. Evolution of the <em>Bacillus</em> genus as a biopesticide in the industry.
Figure 4. Evolution of the Bacillus genus as a biopesticide in the industry.

Page 2 of 8